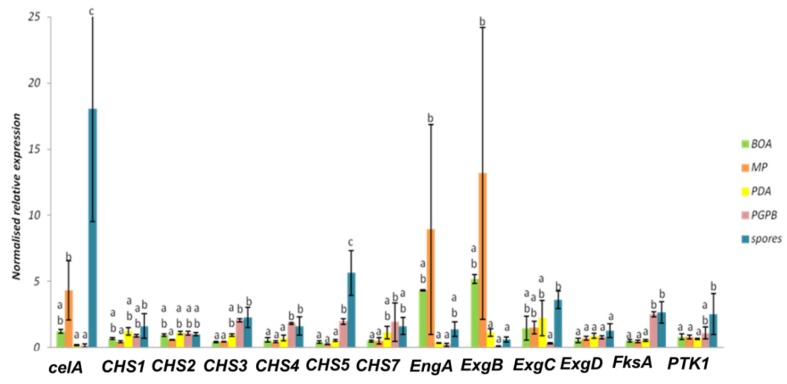
Figure 6.
Normalized relative expression of cell wall genes of D. teres cultivated on different media. Different letters indicate statistically different values (p-value < 0.05) among the groups of the one-way ANOVA with Tukey’s post-hoc test. Error bars represent the standard deviation of four independent biological replicates.

