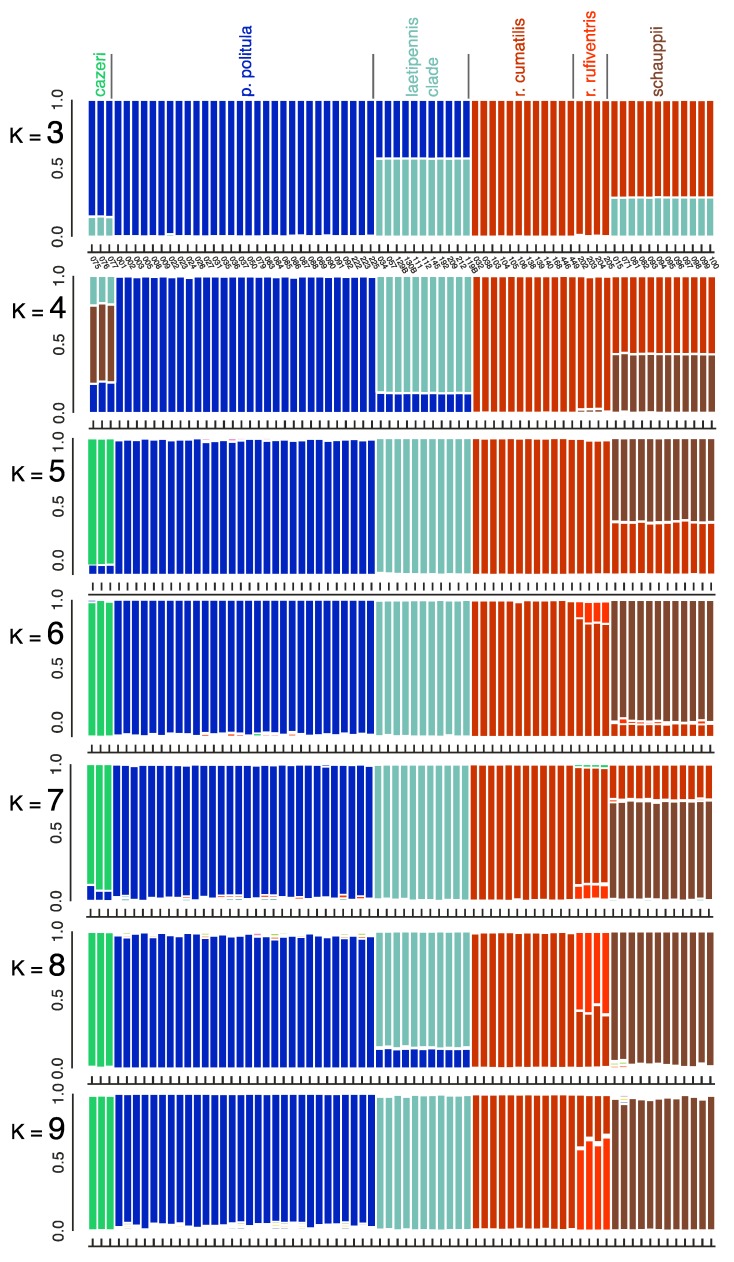
Figure 6.
STRUCTURE analyses of 2228 RADseq loci. Loci were limited to those found in a minimum of 50% of individuals in each taxonomic group and in 75% of individuals overall to produce a SNP matrix with relatively little missing data (12.81%). Delta-K and mean log probability plots are illustrated in Figure S2.

