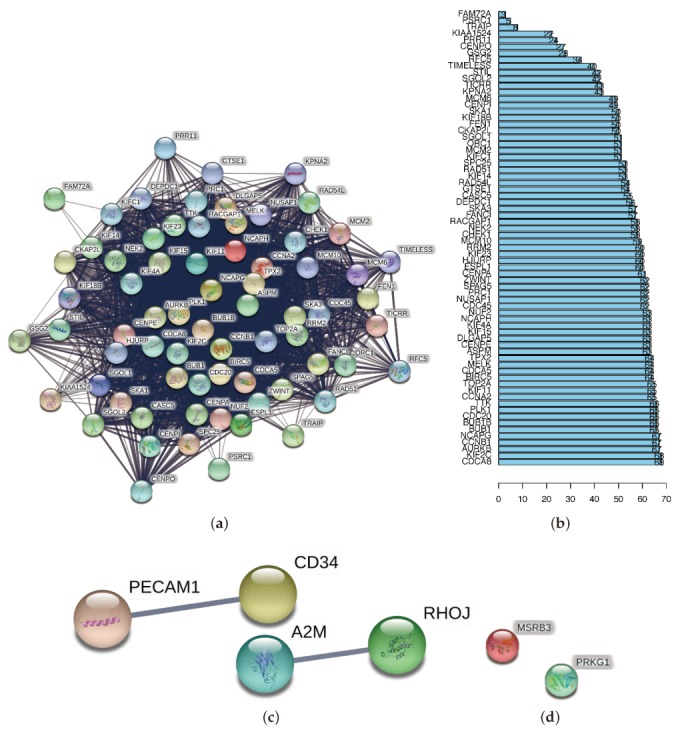
Figure 6.

(a,c,d) PPI networks were drawn using the online tool STRING (URL: https://string-db.org/), for the key proteins from the blue, brown, and purple modules. We set the minimum required interaction score as medium confidence (0.4) and hid disconnected nodes in the network. (b) As the blue module had the most distinguished scale, we profiled a bar-plot to list its key genes by the counts of connections.
