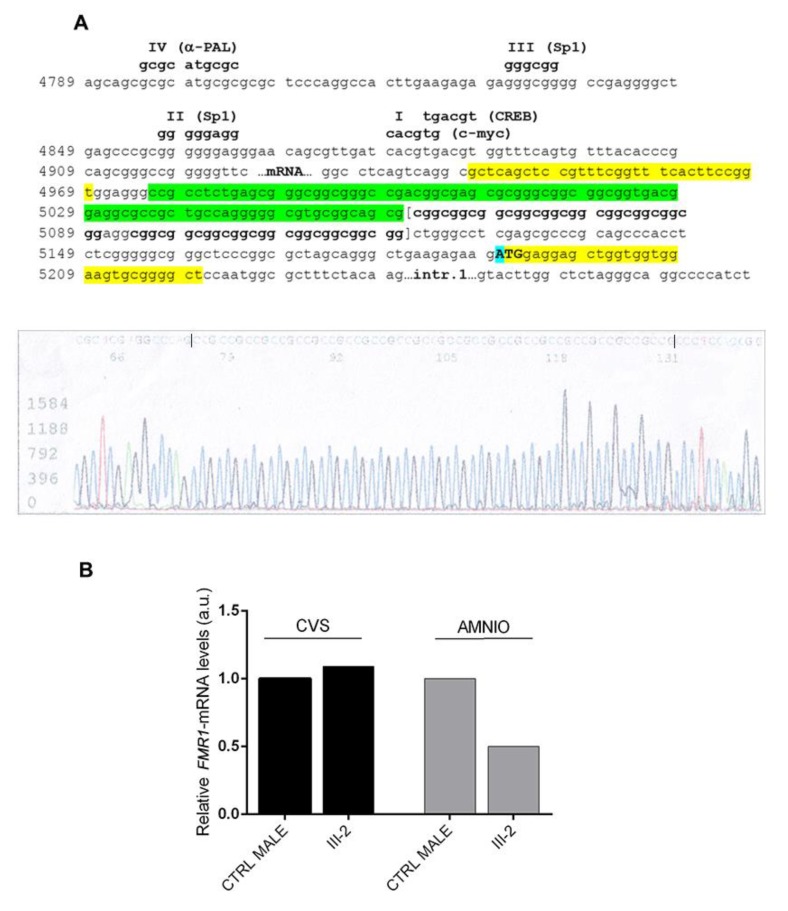
Figure 4.
Sequencing analysis of the FMR1 promoter region and FMR1 expression levels in proband III-2 from Family 2. (A) The upper panel details the sequence of the FMR1 promoter region (according to reference sequence NG_007529.2). The 85 bp deleted region (nucleotides 4975–5060) in proband III-2 is indicated in green and only 19 CGGs were visible following the deletion. Highlighted in yellow are the sequences of the “c” and “f” primers used to sequence the proband’s genomic DNA. The ATG (first codon) is indicated in upper case and the A (c.1), highlighted in blue, corresponds to position 5190 of NG_007529.2. The four known footprints (IV, III, II and I) are indicated above the DNA sequence with the transcriptional factors that bind them. The lower panel shows the electropherogram of III-2 genomic sequence using a reverse primer (therefore CCG repeats can be observed). (B) Relative quantification of FMR1-mRNA by RT-PCR on CVS and amniocytes of proband III-2 and matched controls (CTRL). In CVS FMR1-mRNA was expressed at the same level of a control male, while in amniocytes FMR1 expression levels were approximately 50% lower in III-2 compared to the control. Values reported on the y-axis represent relative transcriptional levels normalized to the control sample, arbitrarily set to 1.

