Figure 2.
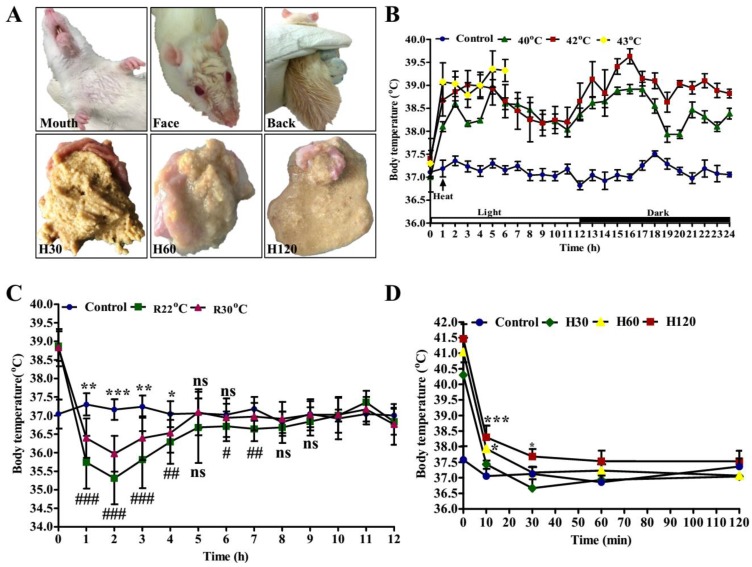
Behavior and physiological changes after heat stress (HS). (A) The behavior of rats at 42 °C HS. Figure 1A displays the sweating of rats and the state of their gastric content with prolonged HS time, sorted according to the order of sweating sites; (B) the body temperature of rats exposed to control (22 ± 1 °C) (n = 9), 40 °C (n = 9), and 42 °C (n = 18) conditions. The number 0 on x-axis means rats were at the control condition and 1-24 means 24 h, from 06:00 a.m. to 05:00 a.m. the next day; (C) body temperature recovery monitoring of the H120 group at ambient temperatures of 30 °C (R30 °C, n = 9) and control (R22 °C, n = 9). * and # represent the significant extent of R30 °C and R22 °C group temperature changes in comparison with the control, respectively. (D) The body temperature recovery of the rats in H30, H60 and H120 groups at 22 ± 1 °C, compared with control. n = 3 per group. Data is represented as mean ± standard deviation. The ns means p ≥ 0.05, *and # p < 0.05, ** and ## p < 0.01, *** and ### p < 0.001 (Student’s t-test).

