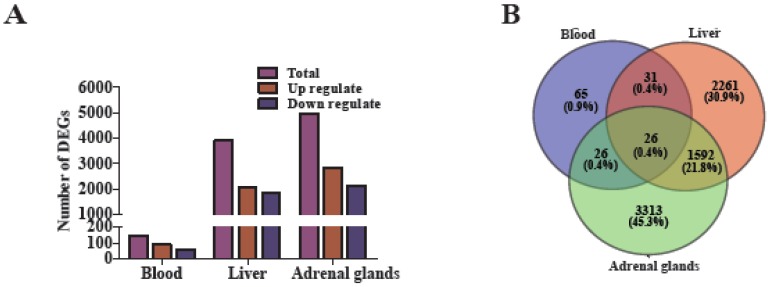
Figure 4.
Comparisons and Pheatmap of the shared and top 20 DEGs in blood, liver, and adrenal gland tissues. (A) Total number of DEGs (q < 0.05; purple), upregulated (red) and downregulated (blue) in blood (n = 4), liver (n = 5), and adrenal glands (n = 5) when rats underwent H120; (B) the Venn diagram displays the common and tissue specific DEGs among blood, liver, and adrenal glands; (C) hierarchical clustering analysis of the commonly identified 26 DEGs from blood, liver and adrenal gland tissues; (D) hierarchical clustering analysis of the top 20 DEGs from blood, liver, and adrenal gland tissues. Upregulated and downregulated refers to the expression levels of genes in H120 rats were higher and lower than the controls, respectively. The log (10+1)-transformed FPKM values (rows) are clustered using hierarchical clustering, and the samples are grouped according to the similarity of gene expression profiles.


