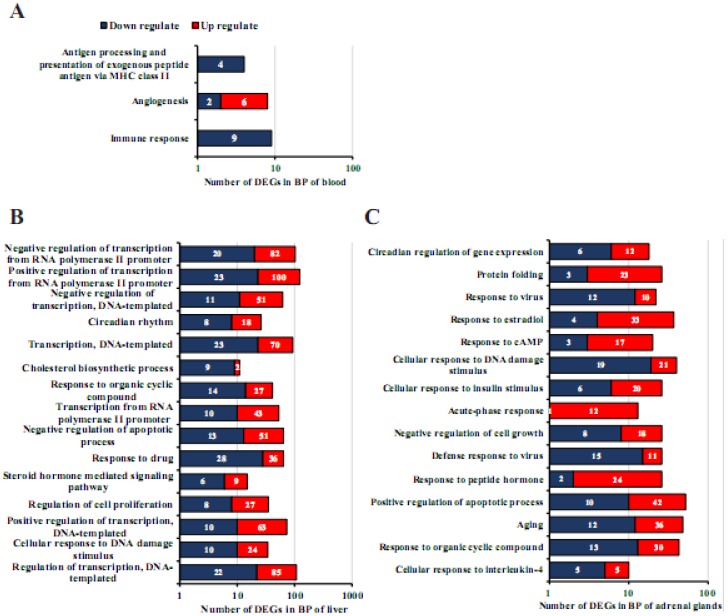
Figure 5.
Significantly enriched biological process (BP) terms of blood, liver, and adrenal gland tissues in H120 vs. Control groups. (A, B and C) The top 15 significantly enriched BP terms identified in blood, liver, and adrenal gland tissues. The number of upregulated (red) and downregulated (blue) DEGs (q < 0.05 and absolute log2 (fold-change) > 1) enriched BPs in blood, liver, and adrenal glands when H120 was compared to control groups. The x-axis coordinates are represented on a logarithmic scale with a radius of 10. The BP terms (up to down) were sorted by q values from small to large.

