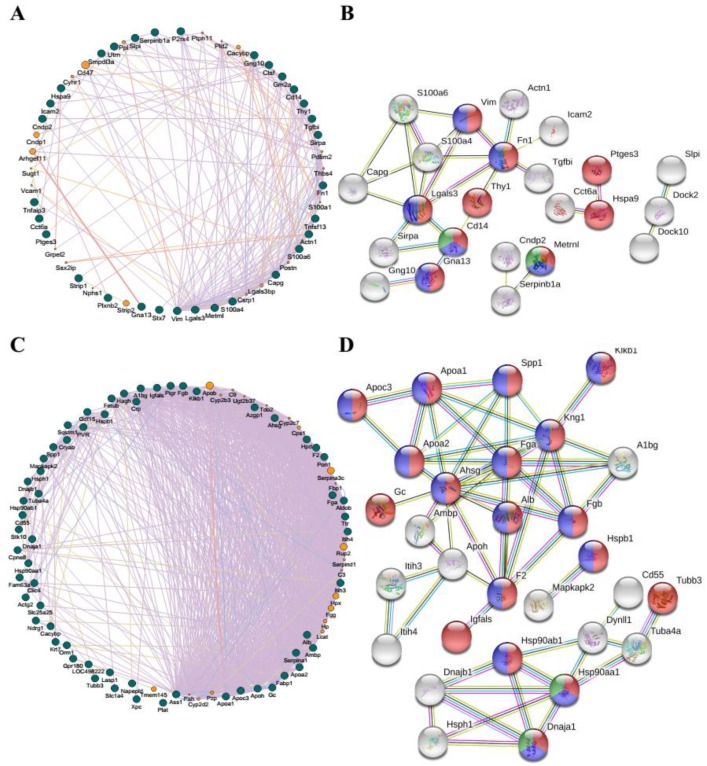
Figure 6.
Gene–gene interaction (GGI) and protein–protein interaction (PPI) predicted networks of DEGs enriched in the extracellular exosome post heat stress. (A) The GGI network analysis was performed based on the BPs of all 36 genes in blood produced by GeneMANIA; (B) The PPI network analysis of 23 genes in blood produced by STRING.11 (confidence 0.4). The proteins of the remaining 13 genes were disconnected; (C) The GGI network performed based on the BPs of all 69 genes in the adrenal glands produced by GeneMANIA; (D) The PPI network of 29 genes in the adrenal glands produced by STRING.11 (confidence 0.9). The proteins of the remaining 40 genes were disconnected. The GGI network was sorted by degree. A total of 314 genes in the adrenal glands were enriched in the extracellular exosome term, of which 69 genes with log2 (fold-change) >2 were subjected to PPI network analysis. In (A) and (C), the dark green nodes represent the query genes and the orange nodes represent the gene’s function has been validated. Different colored lines represent four types of evidence used in predicting associations: red, co-expression; blue, co-localization; green, physical interactions; grey, pathway; and yellow, shared protein domains. In (B) and (D), each node represents one protein. All the annotated proteins are shown as white nodes and colored nodes represent the proteins involved in stress-related BPs: red, response to a stimulus; blue, response to stress; and green, response to heat (B) or response to temperature stress (D). Different colored lines represent four types of evidence used in predicting associations: yellow, text mining evidence; purple, experimental evidence; light blue, database evidence; and black line, co-expression evidence.

