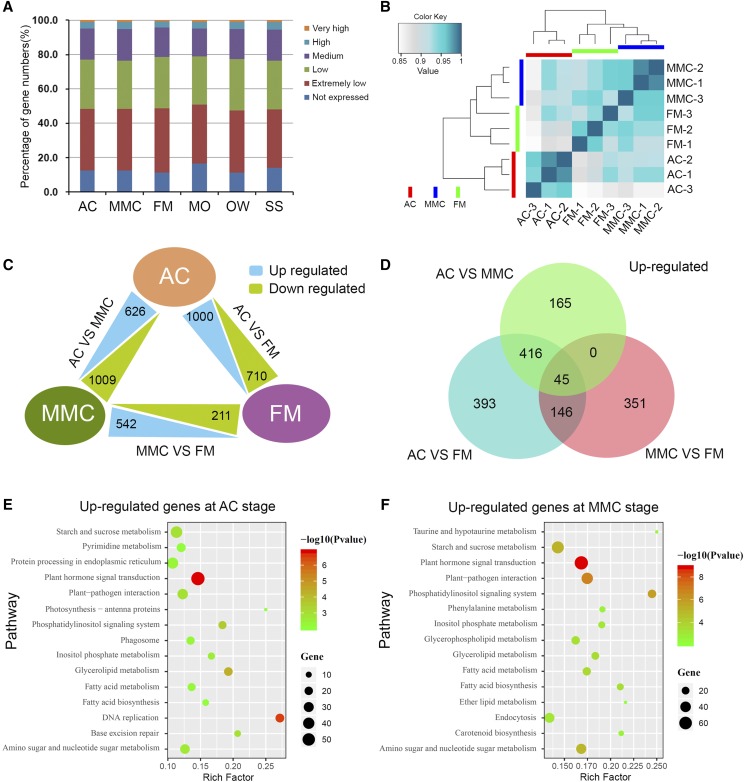
Figure 2.
Global expression levels, DEGs, and KEGG pathway analysis. A, Percentage of gene numbers in different categories according to their expression levels in each tissue, based on FPKM values. B, Hierarchical clustering of the nine samples during rice megasporogenesis using Pearson correlation coefficients. C, Numbers of differentially expressed genes among AC, MMC, and FM tissues. D, Numbers of up-regulated genes in AC versus MMC, AC versus FM, and MMC versus FM. E and F, KEGG pathway analysis for up-regulated genes in AC versus FM (E) and MMC versus FM (F).

