Figure 4.
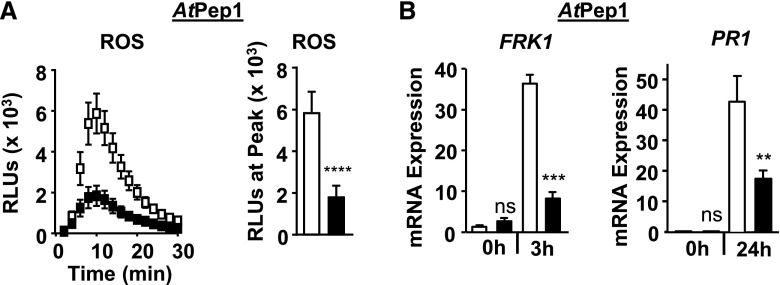
EPS1 is required for robust AtPep1 signaling. A, Time course and peak for AtPep1-triggered (10 nm) apoplastic ROS production from 8-d-old seedlings. n = 20 samples per genotype per treatment, with each sample (n) consisting of one cotyledon half obtained from five or more individual seedlings for each genotype and treatment. The experiment was performed twice in seedlings and twice in leaf discs with similar results. RLU, Relative light units. B, For FRK1 mRNA accumulation, 8-d-old seedlings were treated with 100 nm AtPep1 for the indicated times in hours. n = 3 to 4 samples per genotype per treatment, with each biological sample (n) containing three to four seedlings. For PR1 mRNA accumulation, leaves of 5- to 6-week-old plants were infiltrated with 1 µm AtPep1 for the indicated times. n = 6 samples per genotype per treatment, with each sample (n) containing three leaf discs taken from three to four different plants for each genotype and treatment. Relative mRNA levels of FRK1 and PR1 were measured and normalized to the reference gene At2g28390. Values represent means ± se. For all experiments, eps1-2 is represented by black squares or bars and Col-0 is represented by white squares or bars. Asterisks indicate statistically significant differences compared with the wild type by two-tailed Student’s t test: **, P < 0.01; ***, P < 0.001; ****, P < 0.0001; ns, no statistically significant difference. Unless specified otherwise, all experiments were performed at least three times with similar results.

