Figure 8.
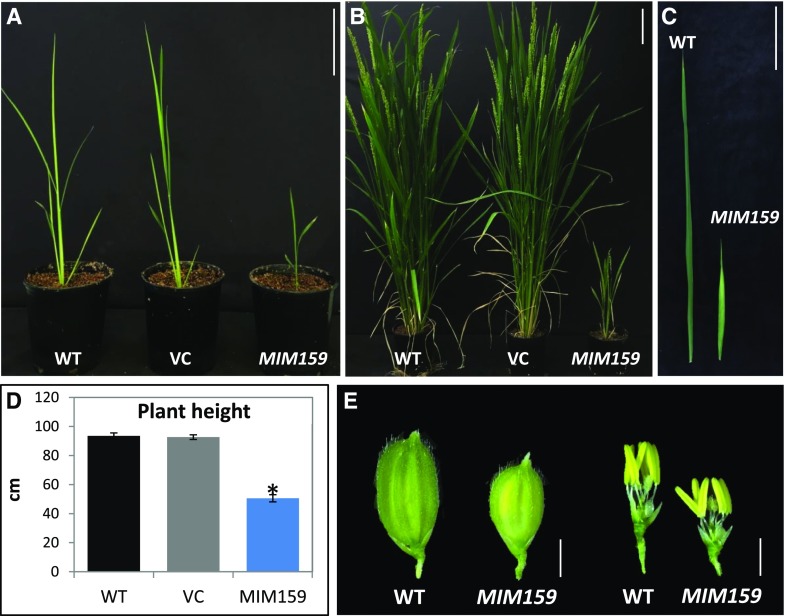
Phenotyping of MIM159 rice. A, Three-week-old wild-type (WT), VC, and MIM159-transgenic rice. Scale bar = 10 cm. B, Eleven-week-old MIM159 transgenic plants displayed smaller growth stature compared to wild-type and VC plants. Scale bar = 10 cm. C, Flag leaves of wild-type and MIM159 plants. Scale bar = 10 cm. D, Average plant heights of wild-type plants, VC T1 plants, and MIM159 T1 plants (n = 10, 10, and 20, respectively). The VC and MIM159 T1 plants analyzed were derived from multiple independent transgenic lines. Error bars represent the se and the asterisk indicates a statistically significant difference compared to the wild type as determined by Student’s t test. E, Floret, anther, and pistil phenotypes of wild type and MIM159 transgenic plants. Scale bars = 2 mm. The different plant parts were digitally extracted for comparison.

