Figure 4.
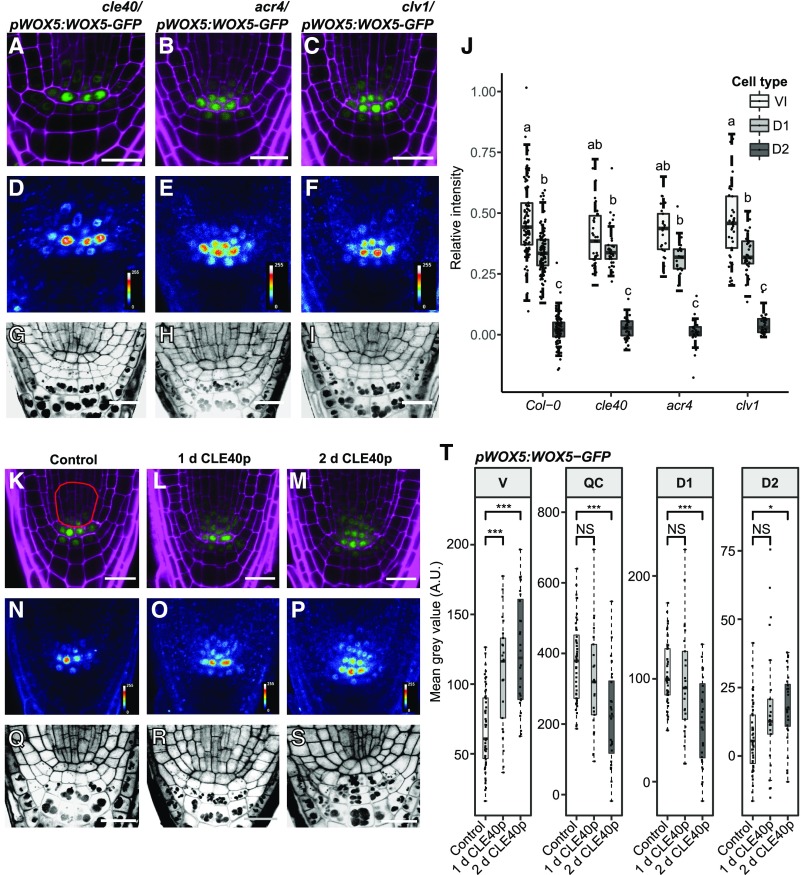
CLE40p up-regulates WOX5 expression in the vascular initials, but WOX5 mobility is not dependent on CLE40p, ACR4, or CLV1. A to I, Images of 5-d-old roots of cle40/pWOX5:WOX5-GFP, acr4/pWOX5:WOX5-GFP, and clv1/pWOX5:WOX5-GFP, showing GFP (green) and PI (magenta) fluorescence (A–C), false color images (D–F), and mPS-PI staining (G–I) of the indicated lines. Scale bars = 20 µm. J, Fluorescence ratio between the indicated regions—vascular initials (VI), D1, D2, and the QC—of the indicated lines. Significant differences (P < 0.05) as determined by two-way ANOVA with Tukey's post hoc analysis are indicated by lowercase letters above the bars (n ≥ 25). K to S, Images of 5-d-old roots of pWOX5:WOX5-GFP under control conditions or treated with CLE40p for 1 or 2 d. Shown are GFP (green) and PI (magenta) fluorescence (K–M), false-color images (N–P), and mPS-PI staining (Q–S) of the indicated lines. The red outline in K indicates the vascular region used for intensity measurements in T. Scale bars = 10 µm. T, Fluorescence intensity depicted as the mean gray value of WOX5-GFP under control conditions and after 1 or 2 d of CLE40p treatment in the indicated cell types. Significant differences as determined by two-sided t test (NS, not significant, *P ≤ 0.05, **P ≤ 0.01, ***P ≤ 0.001; n ≥ 25). A.U., Arbitrary units; V, vascular region.

