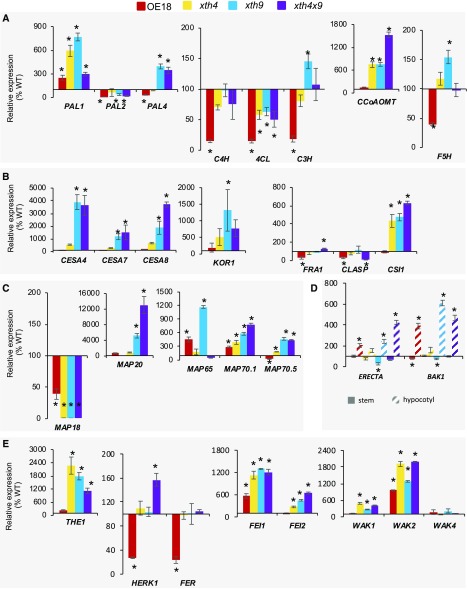
Figure 8.
Expression levels of genes affected in the xth mutants and OE18 plants. Genes related to lignin biosynthesis (A), secondary wall cellulose biosynthesis (B), microtubule dynamics (C), secondary xylem regulation in hypocotyl (D), and cell wall integrity sensing (E) were determined by RT-qPCR. Expression levels were normalized to the wild type (WT; 100%). Data are means ± se; n = 3 biological replicates. Asterisks indicate means significantly different from the wild type (post-ANOVA Student’s t test, P ≤ 0.05).

