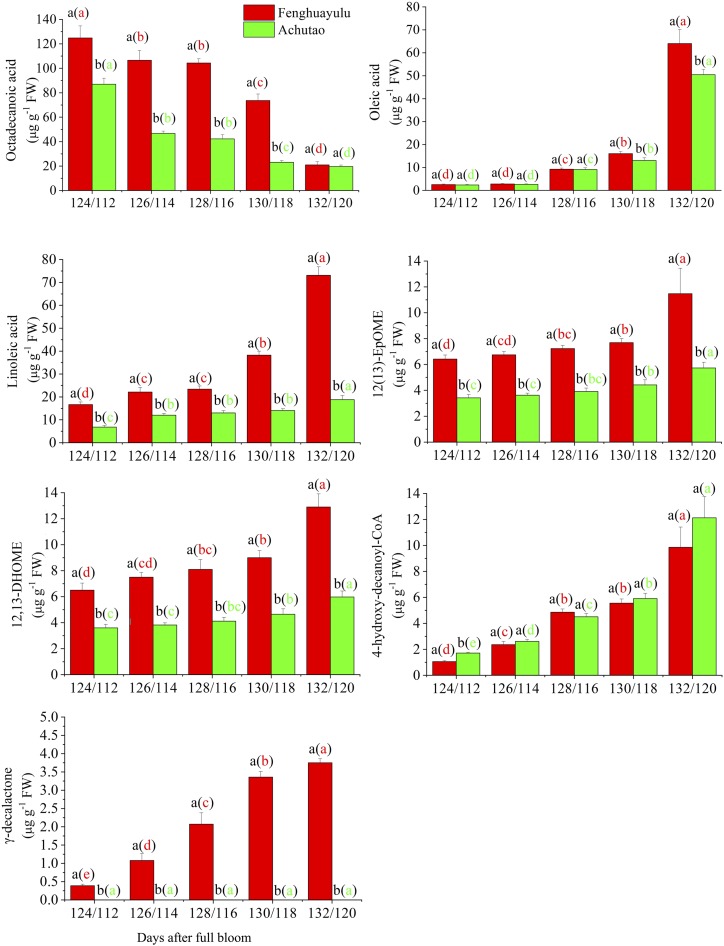
Figure 2.
Accumulation profiles of intermediates in the putative γ-decalactone pathway in cvs Fenghuayulu and Achutao. Data are presented as means ± se (n = 3). Letters indicate statistical differences at P ≤ 0.05 as determined using ANOVA followed by Fisher’s lsd test. Letters outside parentheses indicate differences between the two cultivars at each developmental stage, and those inside parentheses indicate differences in one cultivar across developmental stages. FW, Fresh weight.

