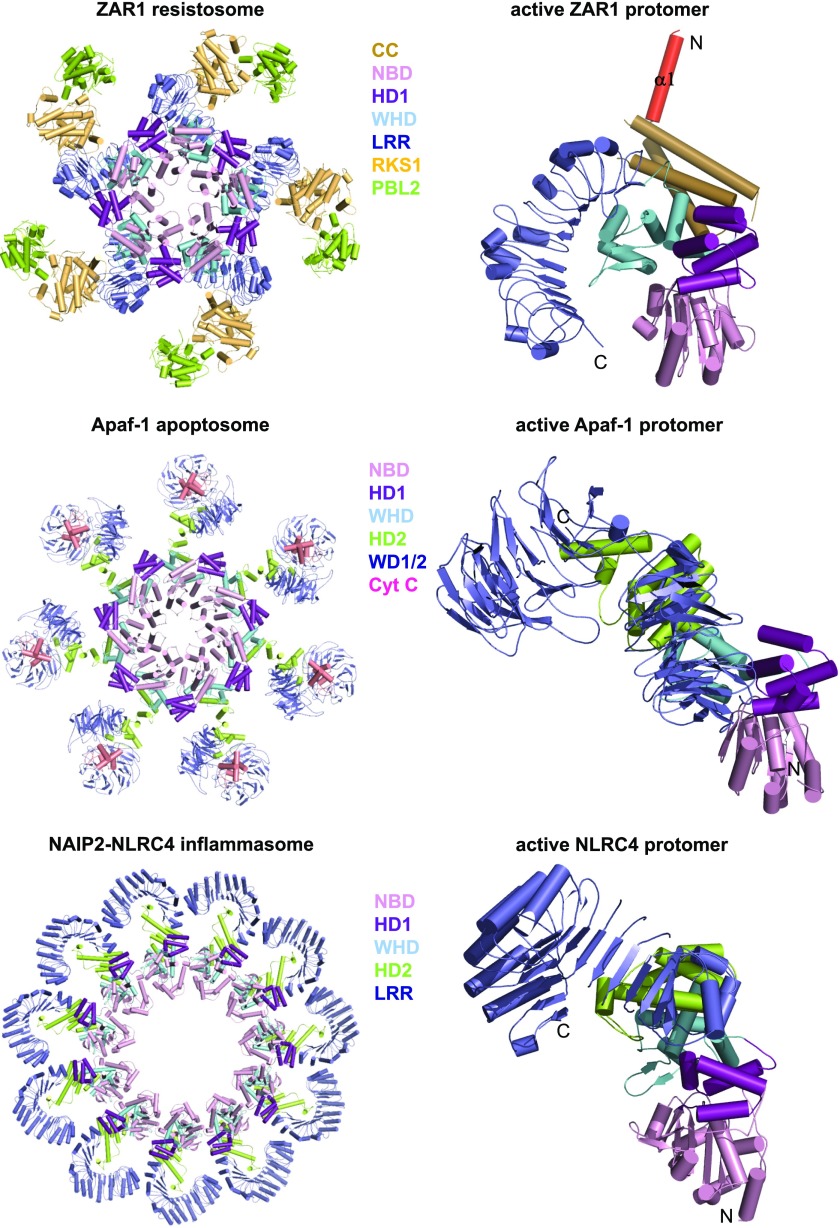
Figure 8.
Structural comparison of active ZAR1, Apaf-1, and NLRC4. Shown in the left column are the structures of the ZAR1 resistosome (PDB: 6J5T), the Apaf-1 apoptosome (PDB: 3JBT), and the NLRC4 inflammasome (PDB: 3JBL). Protomers of these three complexes are shown in the right column with the NBD1–HD1–WHD segments aligned.

