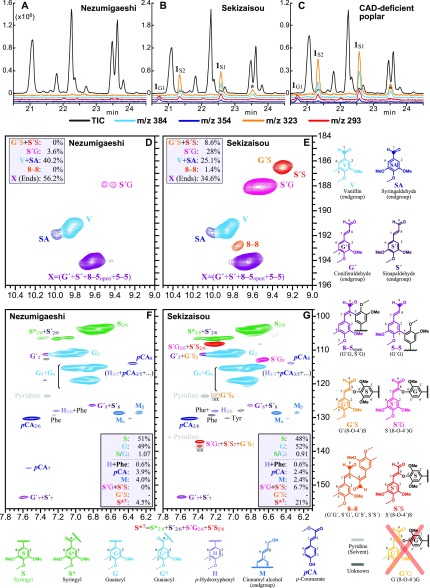
Figure 2.
GC-MS and HSQC analysis. Partial GC-MS traces showing the detection of the diagnostic indene markers released by thioacidolysis of lignins in cv Nezumigaeshi (A), cv Sekizaisou (B), and CAD-deficient transgenic poplar (C). Peaks labeled 1G1, 1S2, and 1S1 correspond to the indenes whose structures are shown in Supplemental Figures S3 and S4. Total-ion (TIC) and selected-ion (m/z 293, 323, 354, and 384) chromatograms are indicated with different colors. The selected-ion chromatograms are shown at 100-fold magnification, and the y axis zero-point is offset so that the chromatograms are more clearly resolved and viewed. Representative chromatograms are shown for 3 independent biological samples. D to G, Two-dimensional heteronuclear single-quantum coherence NMR spectra of cellulolytic enzyme lignins from cv Nezumigaeshi (D and F) and cv Sekizaisou (E and G). The spectra show the aldehyde (D and E) and aromatic (F and G) structures in both lignins. The quantification values shown are for relative comparisons of the lignin components determined from NMR contour volume-integrals. Correlation peaks are colored to match those of the structures; Phe is from Phe (in proteins), and Tyr is from Tyr (in proteins); the H2/6 correlation peak overlaps with a Phe peak so cannot be properly quantified.

