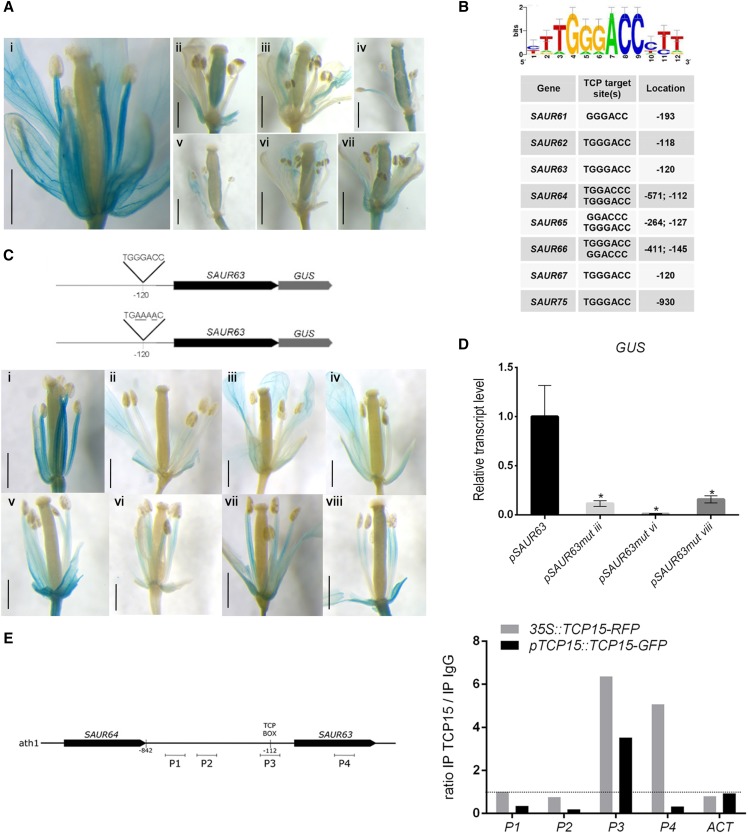
Figure 4.
SAUR63 is a direct TCP15 target. A, GUS expression in a representative plant line that contains a fusion of SAUR63 to gus under the control of the SAUR63 promoter, either in a wild-type background (i) or after transformation of this line with the pTCP15::TCP15-EAR construct (ii–vii are different independent transformants). Scale bars = 1 mm. B, Enrichment of sequences bound by TCPs in the promoter regions of SAUR63 subfamily genes. A sequence logo of a sequence overrepresented in the promoters of SAUR63 subfamily genes, obtained using the Regulatory Sequence Analysis Tool platform (http://rsat.eead.csic.es/plants/), together with a list of the sequences and their locations in the respective promoters, is shown. Sequences are from the coding strand and numbers are relative to the putative transcription start site, except for SAUR75, which corresponds to the complementary strand and is relative to the translation start site. C, Expression of SAUR63-GUS under the control of the native SAUR63 promoter (i; a representative line is shown), or under the control of a mutated version of the promoter in which the sequence TGGGACC located at −120 was mutagenized (ii–viii are different independent lines). Scale bars = 1 mm. Schematics of the constructs used for transformation are shown above. D, Quantification by RT-qPCR of GUS transcript levels in flowers of representative lines from those shown in (C). The bars indicate the mean ± se of three biological replicates. Asterisks indicate significant differences (P < 0.05; Student’s t test). E, ChIP analysis of the binding of TCP15-GFP to the SAUR63 promoter region. The results of two independent experiments, one with 35S::TCP15-RFP plants and the other with plants that express TCP15-GFP under the control of the native TCP15 promoter, are shown. Primer pairs for the amplification of different regions of the SAUR63 gene (P1–P4) and of ACT2 and ACT8 genes (ACT; control) were used. A schematic of the genomic region analyzed, indicating the location of the different fragments, is shown to the left. The results are expressed as the ratio of the signal obtained after immunoprecipitation with specific antibodies and with anti-IgG (control).

