Figure 5.
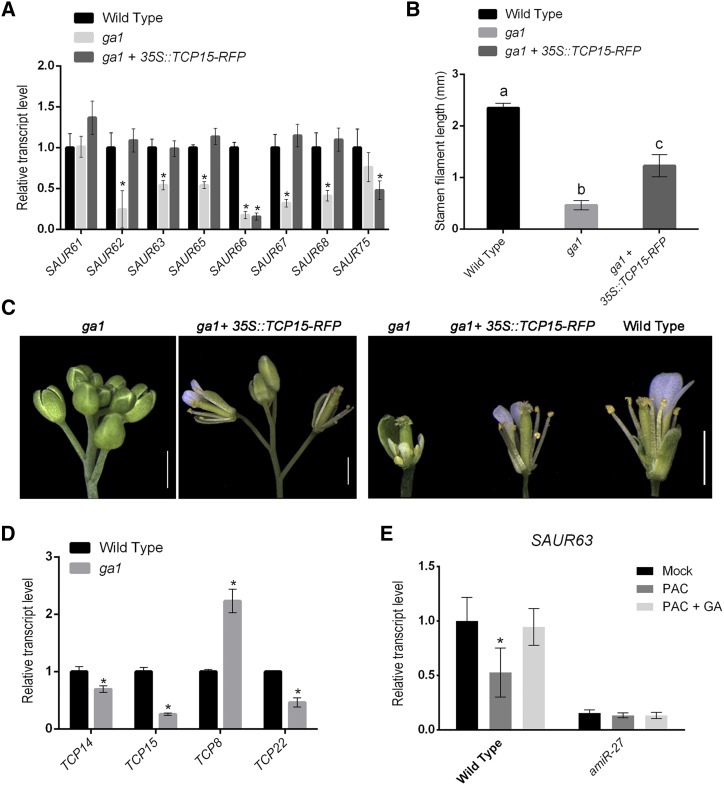
Class-I TCPs participate in GA-dependent stamen filament elongation and SAUR63 subfamily gene expression. A, Transcript levels of SAUR63 subfamily genes in flowers from wild-type, ga1 plants, and ga1 plants transformed with the 35S::TCP15-RFP construct. The results are expressed relative to wild type. Values represent the mean ± se of three biological replicates. Asterisks indicate significant differences with wild-type plants (P < 0.05; Student’s t test). B, Stamen filament length in flowers at stage 13 of wild-type plants, ga1 plants, and ga1 plants that express TCP15-RFP under the control of the 35SCaMV promoter. The bars indicate the mean ± sd (n = 11–23 stamens, depending on the line). Different letters indicate significant differences (P < 0.05; one-way ANOVA for multiple comparisons). C, Phenotype of ga1 plants before and after transformation with a 35S::TCP15-RFP construct. A representative image of five independent lines is shown. A flower of a wild-type plant is included for comparison. Scale bars = 1 mm. D, Transcript levels of class-I TCP genes in flowers from wild-type and ga1 plants. The results are expressed relative to wild type. Values represent the mean ± se of three biological replicates. Asterisks indicate significant differences with wild-type plants (P < 0.05; Student’s t test). E, SAUR63 transcript levels in wild-type and amiR-27 plants 4 h after a single treatment with 10 μM of PAC (PAC) or 10 µM of PAC plus 100 μM of GA3 (PAC + GA). Control plants (Mock) were mock-treated with solvent solution. Values are expressed as relative to wild type under control conditions and represent the mean ± se of three biological replicates. Asterisks indicate significant differences between control and treated plants of the same genetic background (P < 0.05; Student’s t test).

