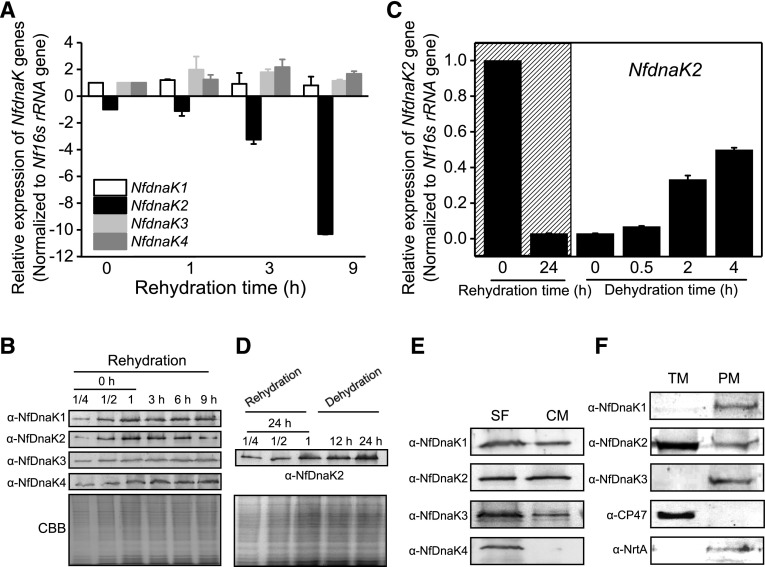
Figure 2.
The expression pattern of NfDnaK homologs during rehydration and dehydration and their subcellular localizations in field-collected N. flagelliforme. A, Relative transcriptional levels of NfdnaKs during rehydration. The dried field-collected N. flagelliforme samples were rehydrated for 0, 1, 6, and 9 h, and three independent replicates were performed for each time point. Total RNA was extracted as described in the “Materials and Methods”. Data are shown as the mean ± sd of three independent replicates. B, Protein levels of four NfDnaKs during rehydration. The dried field-collected N. flagelliforme samples were rehydrated as described in A. Total protein was extracted as described in the “Materials and Methods”. The total protein of the “0 h” sample (with series of dilution for protein loading, 7.5 μg [one-quarter dilution], 15 μg [half dilution], and 30 μg [1, without dilution], respectively) and other samples (30 μg) were loaded in each lane. Each NfDnaK was indicated by the corresponding specific antibodies (ɑ-NfDnaK1–ɑ-NfDnaK4). The corresponding Coomassie brilliant blue (CBB) stained gels beneath the western blotting results were used as loading controls. C, Relative transcriptional levels of NfdnaK2 during rehydration and subsequent dehydration. The dried field-collected N. flagelliforme samples were rehydrated (marked by hatching) for 0 h (dried field samples), 24 h (fully rehydrated), and subsequently dehydrated for 0.5 h (∼20% water loss), 2 h (∼50% water loss), and 4 h (∼90% water loss). Each treatment was repeated three times independently, and data are shown as the mean ± sd of three independent replicates. D, Changes in expression of the NfDnaK2 protein during rehydration and subsequent dehydration. The dried field-collected N. flagelliforme samples were rehydrated for 24 h and subsequently dehydrated for 12 h and 24 h. The total protein of the “24 h” sample (with series of dilution for protein loading, 7.5 μg [one-quarter dilution], 15 μg [half dilution], and 30 μg [1, without dilution], respectively) and other samples (30 μg) were loaded in each lane. The corresponding CBB stained gels beneath the western blotting results were used as loading controls. E and F, Subcellular localizations of NfDnaKs. The total proteins extracted from dried field N. flagelliforme samples were fractionated into soluble fractions (SF) and crude membranes (CM), and 30 μg protein was loaded in each lane (E). Crude membranes were subsequently separated into thylakoid membranes (TM) and plasma membranes (pm) by Suc density gradient centrifugation, and 30 μg protein was loaded in each lane (F).

