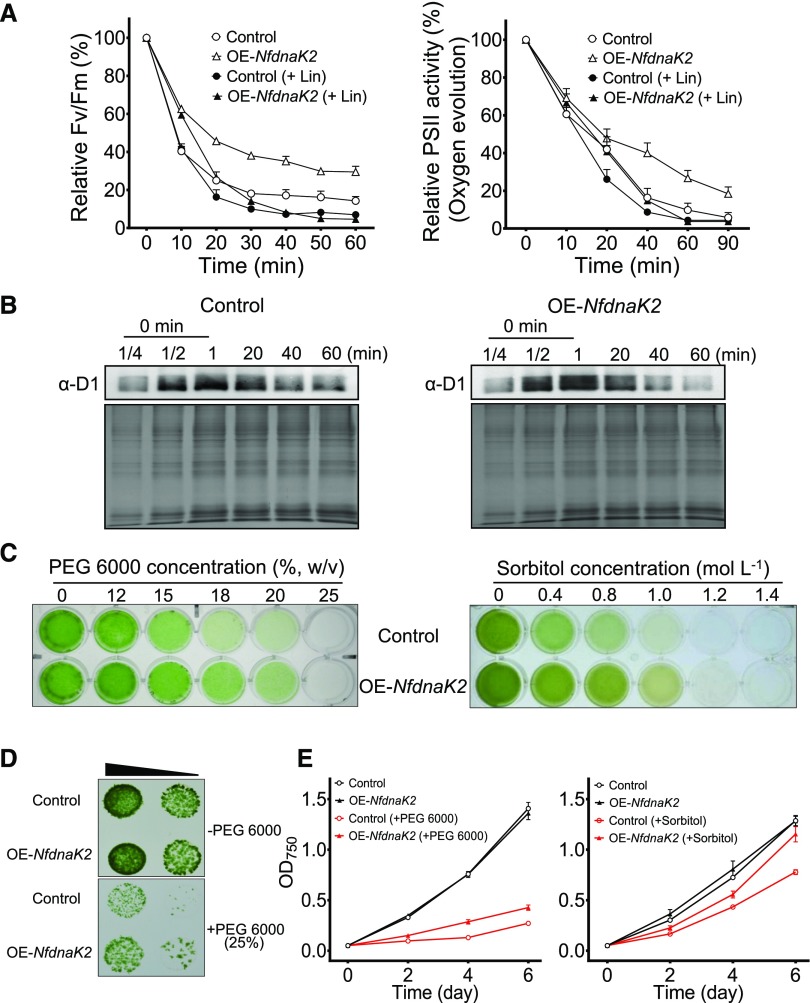
Figure 5.
Heterologous expression of NfdnaK2 enhanced PSII repair and drought tolerance in Nostoc sp. PCC 7120. A, Effect of high light (400 μmol photons m−2 s−1) on Fv/Fm and PSII oxygen evolution of wild-type and NfdnaK2-overexpressing (OE-NfdnaK2) Nostoc sp. PCC 7120 strains in the absence (open symbols) or presence (solid symbols) of 100 mg mL−1 Lin. Exponential growth cultures with OD750 0.4 were exposed to high light and withdrawn at the indicated times for Fv/Fm and oxygen evolution measurements. Wild-type Nostoc sp. PCC 7120 was used as a control to compare with the OE-NfdnaK2 strain. Each treatment was carried out for four independent replicates, and the 100% values corresponded to the values at time point zero of two strains. Data are shown as the means ± sd of four independent replicates. B, Comparison of D1 degradation between wild-type (Control) and OE-NfdnaK2 Nostoc sp. PCC 7120 strains. The samples were treated with high light, as shown in A, in the presence of Lin, and collected at the indicated times. The thylakoid membrane proteins of different samples (30 μg) were loaded into each lane (except for the series of dilution for the “0 min” sample protein loading, 7.5 μg [one-quarter dilution], 15 μg [half dilution], and 30 μg [1, without dilution], respectively) and separated by 15% (v/v) SDS-PAGE and subjected to western blotting analyses. The corresponding Coomassie brilliant blue stained gels beneath the western blotting results were used as protein loading controls. C to E, Growth comparison of wild-type (Control) and transgenic strains upon PEG 6000 (C–E) or sorbitol treatment (C and E). Cells were grown in culture plates for 5 d under treatment with various concentrations of PEG 6000 or sorbitol (C) or on BG11 agar plates (10 µL drops of cell culture with OD750 0.4 and 0.04, as indicated by the slope of the black triangle from left to right) with or without 25% (w/v) PEG infusion (D), or grown in flasks in the presence or absence of 18% (w/v) PEG 6000 or 1 mol L−1 sorbitol (E). Each treatment was carried out for three independent replicates for two strains, and data are shown as the mean ± sd of three independent replicates.

