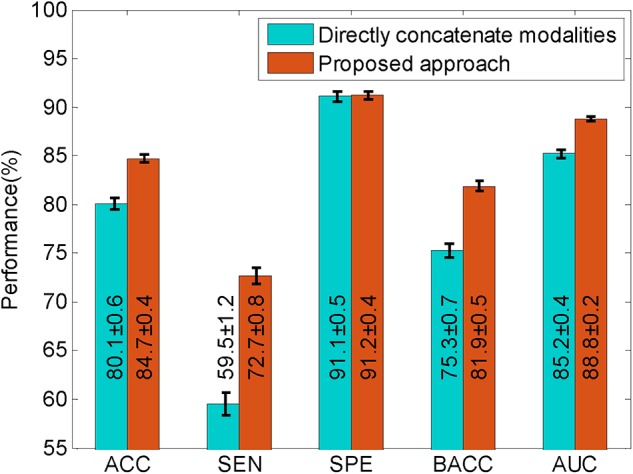
FIGURE 2.

The comparison of the proposed approach with the method that directly concatenates multiple modalities. The black lines superimposed on each bar, and the second number in each bar represents the standard deviations derived from 100 runs of validation. ACC, accuracy; AUC, area under receiver operating characteristic curve; BACC, balanced accuracy; SEN, sensitivity; SPE, specificity.
