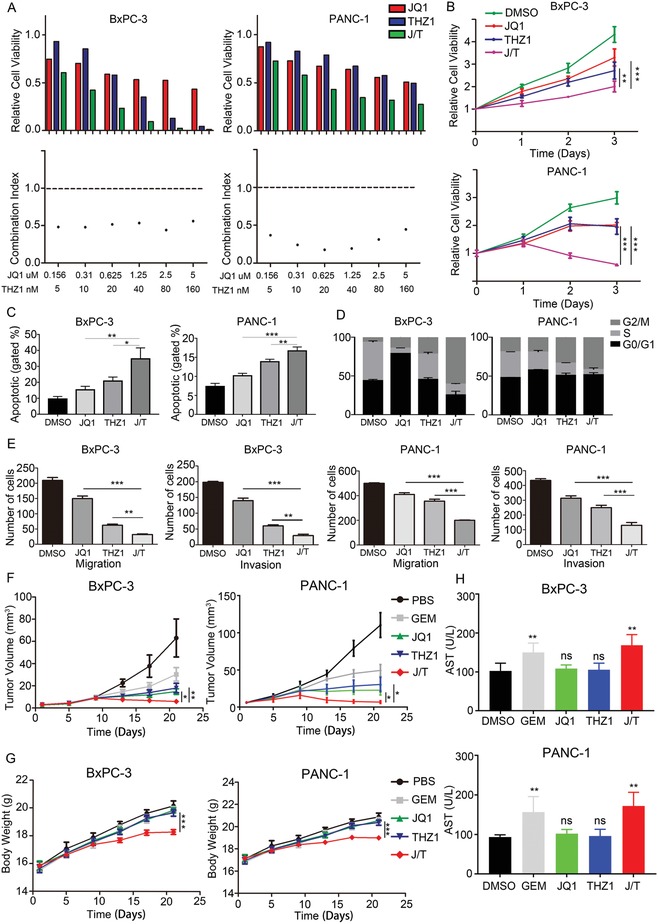
Figure 2.

Synergistic effects of JQ1 and THZ1 against PDAC. A) Viability and synergy in JQ1 and THZ1 treatments. PDAC cultures treated with JQ1 and THZ1 individually or in combination at indicated concentrations for 48 h. Top) Cell viabilities were measured and normalized to DMSO control values (n = 3 wells per data point). Bottom) CI was calculated by using CalcuSyn software. CI less than 1 demonstrates synergy between two drugs. B) Cell viability assay showing the effects of JQ1 or/and THZ1 treatment on BxPC‐3 and PANC‐1 cells at indicated time points. C) Apoptosis analysis of BxPC‐3 and PANC‐1 cells treated with JQ1 or/and THZ1. D) Cell cycle analysis of BxPC‐3 and PANC‐1 cells treated with JQ1 or/and THZ1. E) Invasion and migration assays of BxPC‐3 and PANC‐1 cells treated with JQ1 or/and THZ1. F) Tumor growth curves of the mice (n = 6 per group) treated with PBS, Gemcitabine (50 mg kg−1, twice per week), JQ1 (50 mg kg−1, daily), THZ1 (10 mg kg−1, twice daily), and JQ1 (50 mg kg−1, daily) combined with THZ1 (10 mg kg−1, twice daily) for 21 days. The tumor volume was monitored every 4 day. G) Weight of tumors derived from mice (n = 6) in each group. H) Serum AST of mice (n = 6) in each group. Data are presented as mean ± SD. *p < 0.05, **p < 0.01, and ***p < 0.001 were calculated according to a Student's t‐test. All presented results are from three independent experiments.
