
Figure 6.
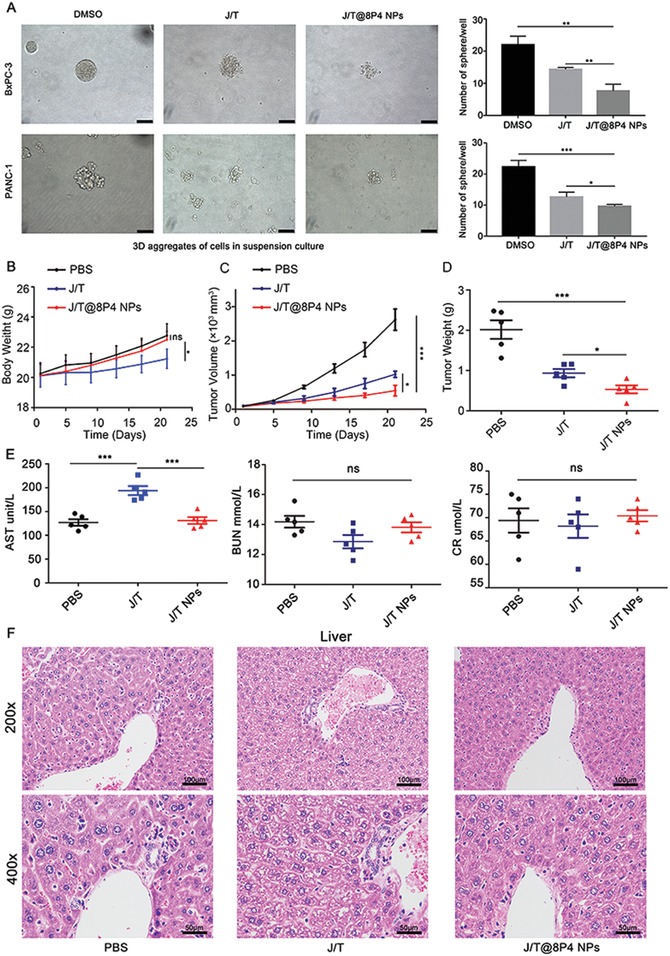
Tumor targeting efficiency of the 8P4 NPs in vivo. A) Tumor sphere formation assay of BxPC‐3 and PANC‐1 cells upon different treatment (DMSO, J/T, or J/T@8P4 NPs) on day 5. The sphere numbers were counted on day 7. B) PDX‐tumor (PDX0032) bearing mice were treated with PBS, J/T(JQ1 50 mg kg−1, daily; THZ1, 10 mg kg−1, twice daily), or J/T@8P4 NPs (JQ1 20 mg kg−1, THZ1, 10 mg kg−1, daily) for 21 days, respectively. Body weight of the mice (n = 5 each group) during the treatment period. C) Tumor growth curves of the mice (n = 5 each group). D) Weight of PDX tumors derived from the mice (n = 5 each group) in different group. E) Serum ALT, BUN, and CR from the mice (n = 5 each group). F) H&E staining of liver from the mice (n = 5 each group) in different group. Data are presented as mean ± SD. *p < 0.05, **p < 0.01, and ***p < 0.001 were calculated according to a Student's t‐test. All presented results are from three independent experiments.