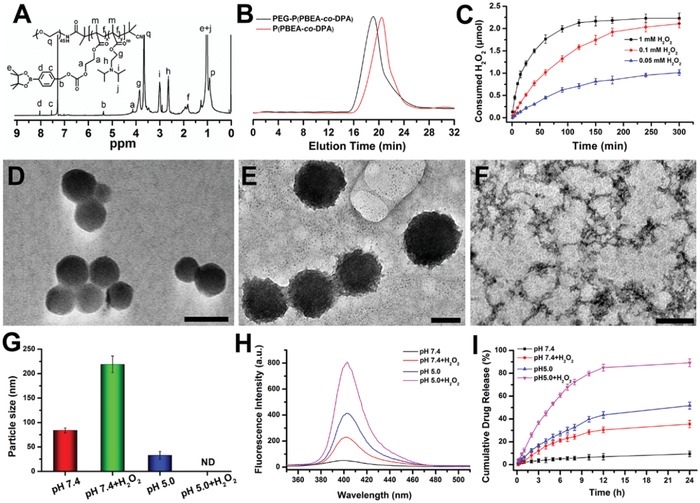
Figure 1.

The characterization of polymer and PD‐MC. A) The 1H NMR spectra of the final polymer PEG‐P(PBEM‐co‐DPA) in CDCl3‐d. B) The GPC traces recorded for P(PBEM‐co‐DPA) and PEG‐P(PBEM‐co‐DPA). C) Consumed H2O2 after incubation of polymer (PBEM unit, 0.1 × 10‐3 m) in various concentrations of H2O2 solution (0.05 × 10‐3, 0.1 × 10‐3, and 1 × 10‐3 m) for different time points at 37 °C. The Total solution volume was 22 mL, the data were monitored by a UV–vis spectrometer at 375 nm. n = 3. The TEM images of D) PD‐MC in pH 7.4, E) pH 7.4 + H2O2, and F) pH 5.0 + H2O2. The scale bars represent 100 nm in (D) and (E), and 200 nm in (F), respectively. G) The particle size of PD‐MC at various conditions detected by DLS. n = 3. ND means none detected. H2O2 concentration if applied in (D)–(I): 0.1 × 10‐3 m. H) The fluorescence intensity changes of PD after incubation of PD‐MC at different conditions. I) In vitro PD release from PD‐MC solution under various conditions. n = 3.
