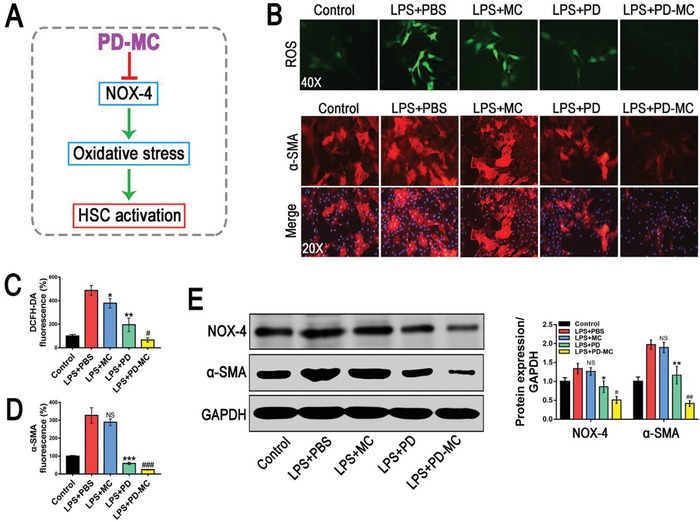
Figure 3.

The anti‐fibrotic efficacy of PD‐MC on HSC phenotype in LX‐2 cells challenged by LPS. A) Schematic illustration of the anti‐fibrotic mechanism of PD‐MC in HSCs. B–D) The levels of oxidative stress and α‐SMA expression were measured by DCFH‐DA probe and immunofluorescence assay, respectively. n = 3. E) The protein expressions of NOX4 and α‐SMA were assayed by Western blot. n = 3. NS, no significance; *p < 0.05, **p < 0.01, and ***p < 0.001 versus LX‐2 induced by LPS. #p < 0.05 and ###p < 0.001 versus LPS induced LX2 treated with free polydatin.
