
Figure 1.
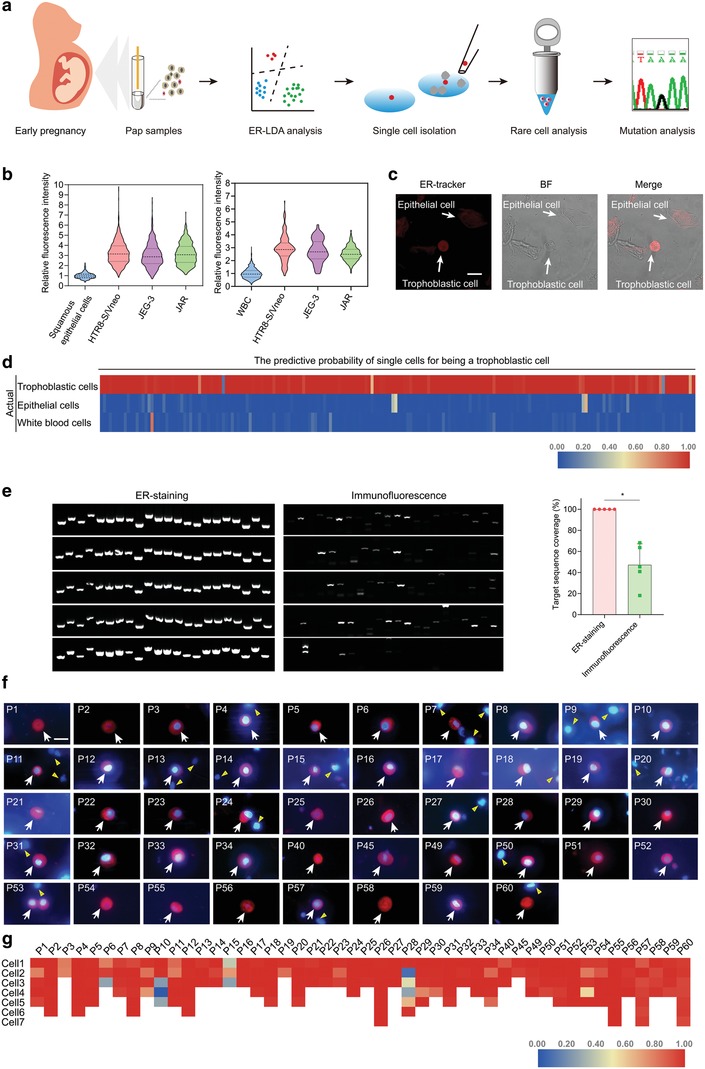
Development of ER‐LDA for analyzing rare trophoblastic cells. a) The working principle of ER‐LDA cell‐based test. ERhigh/DAPI+ cells are analyzed by LDA, validated by STR, and isolated at single‐cell level for sequencing. ERhigh cells, candidate trophoblastic cells with deep staining of endoplasmic reticulum. DAPI, 4′,6‐diamidino‐2‐phenylindole. b) The relative fluorescence intensity of ER‐tracker in three trophoblastic cell lines, HTR8‐S/Vneo, JEG‐3, and JAR, and in squamous epithelial cells and white blood cells taken from healthy female donors. CFDA‐SE pre‐labeled trophoblastic cells are mixed with a proportion of squamous epithelial cells or white blood cells, stained with ER‐tracker and imaged by a fluorescence microscope. The fluorescence intensity of each single cell is quantified by Image J software, and the relative fluorescence intensity between trophoblastic cells and squamous epithelial cells or white blood cells is calculated. Lines represent the mean values and the interquartile range of 5 replicates. c) ERhigh trophoblastic cells imaged by confocal microscopy. CFDA‐SE pre‐labeled trophoblastic cells can be easily identified by ER‐Tracker in spiked‐in samples. Scale bar, 20 µm. d) The LDA predictive probability of 200 trophoblastic cells, 200 squamous epithelial cells and 200 leukocytes in test cohort. e) The coverage of WGA products assessed by the amplification of 22 genomic loci. Five single cells identified by ER‐LDA or β‐HCG intracellular labeling are used for each test and five replicates are performed (Mean ± SD). Mann‐Whitney U test, *P < 0.05. f) Representative images of ERhigh trophoblastic cells in 48 Pap samples. Cells are stained with ER‐Tracker and DAPI. ER‐Tracker is shown in red; DAPI is shown in blue. The white arrows indicate the target trophoblastic cells and the yellow triangles show the maternal cells. Before single‐cell isolation, these cells are mixed with a proportion of maternal cells. Scale bar, 20 µm. g) The LDA predictive probability of 209 candidate trophoblastic cells from 48 Pap samples. Two to 7 single cells per sample are analyzed and collected for WGA.