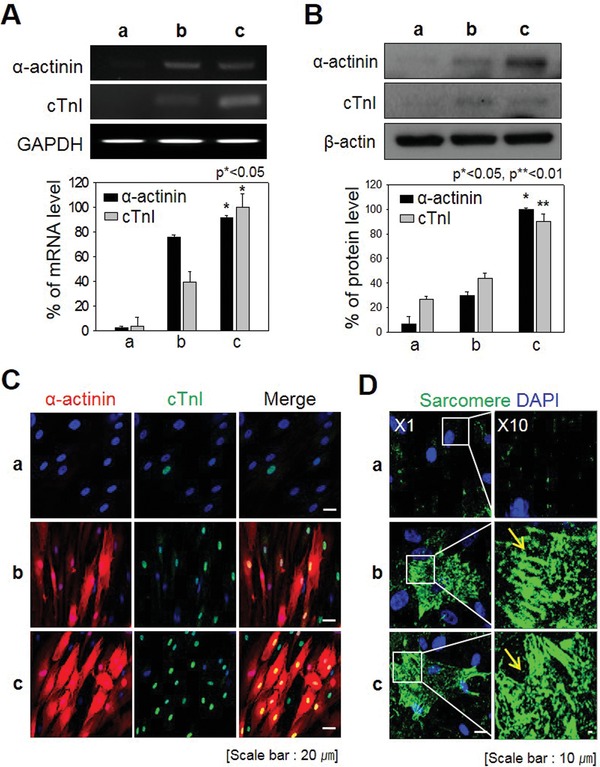
Figure 5.

Expression of late cardiac markers relative to positive controls. A) mRNA levels of α‐actinin and cTnI (p < 0.05). B) Protein levels of α‐actinin and cTnI (p < 0.05 and p < 0.01). C) Immunofluorescence staining for α‐actinin and cTnI. D) Sarcomere staining to confirm myocyte morphology. a) NC; b) CiCMC; and c) PC.
