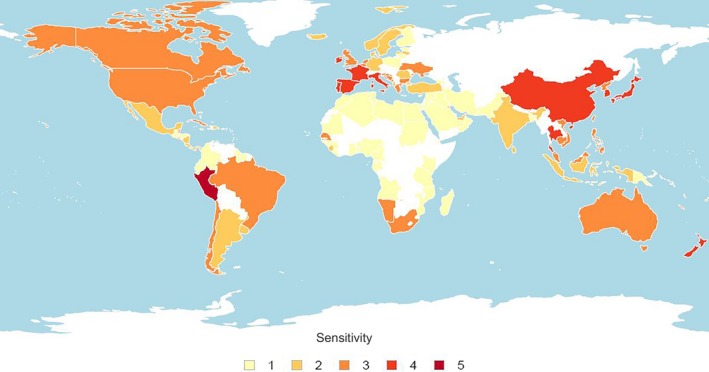
Figure 3.

Sensitivity to CC‐OA for nations with current mollusk aquaculture operations, measured as nation‐specific mean of indices within the sensitivity sublayer. Colors represent sensitivity score (1 = very low, 2 = low, 3 = moderate, 4 = high, and 5 = very high). White areas indicate nations where no data were available
