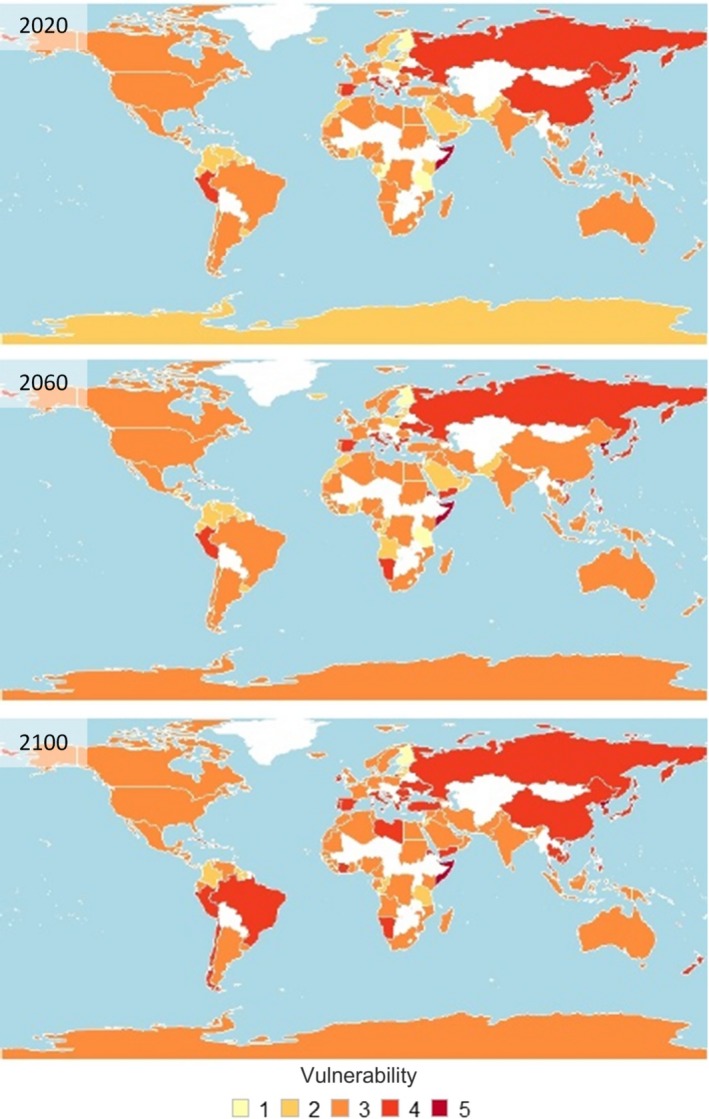
Figure 5.

Overall vulnerability to CC‐OA for coastal nations, measured as nation‐specific mean for exposure, sensitivity, and adaptive capacity sublayers for decades 2020, 2060, and 2100. Colors represent overall vulnerability score, while white indicates the absence of data
