Figure 6.

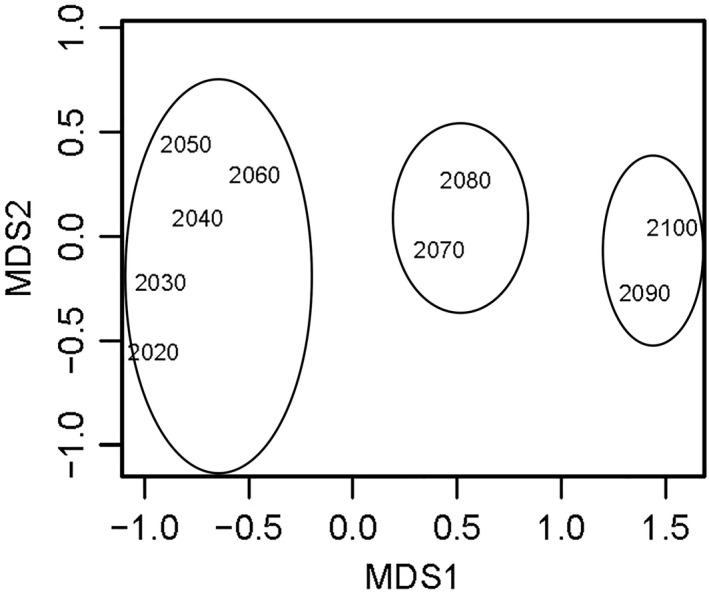
Nonmetric MDS of overall vulnerability to CC‐OA for all coastal, shellfish mariculture‐producing nations from 2020 to 2100. Clusters of decades most similar to each other are grouped. The greatest change (tipping point) occurs after 2060

Nonmetric MDS of overall vulnerability to CC‐OA for all coastal, shellfish mariculture‐producing nations from 2020 to 2100. Clusters of decades most similar to each other are grouped. The greatest change (tipping point) occurs after 2060