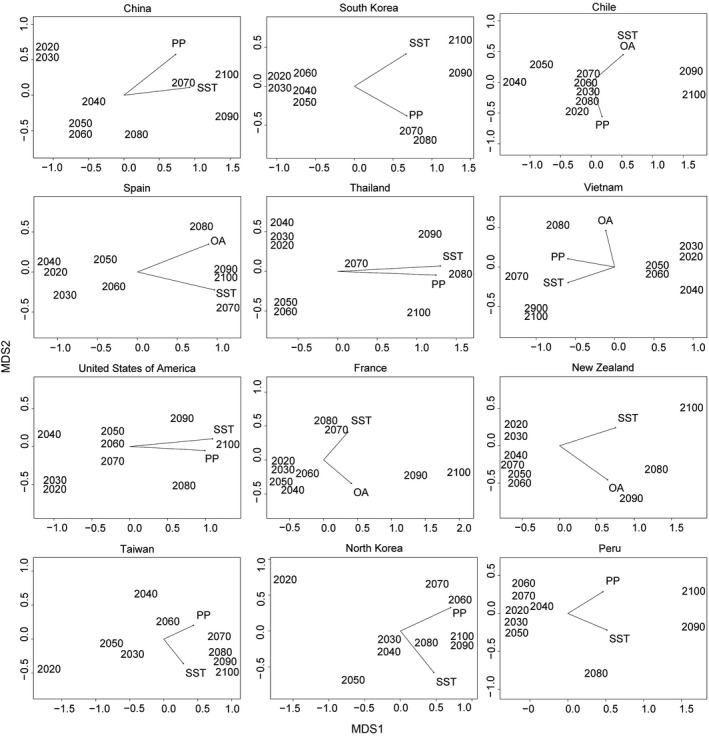
Figure 7.

Nonmetric MDS of overall vulnerability for 12 top‐producing mollusk mariculture nations from 2020 to 2100. The strength and correlation between years and changes in sea surface temperature (SST), primary productivity (PP), and aragonite saturation (OA) are represented by arrows (e.g., for Thailand, the long arrows toward 2080 indicate that this ordination was driven by a strong, positive relationship between decade and increasing SST and declining PP, and that these stressors increased toward 2080/90/100). Stress was <0.010 in all nations with the exception of New Zealand, where it was 0.10
