
Figure 3.
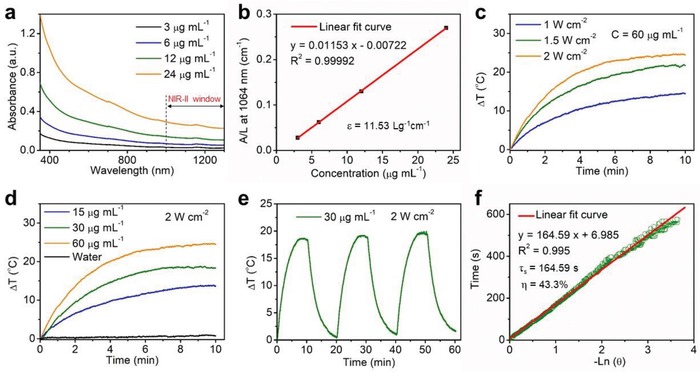
In vitro photothermal performance. a) Vis–NIR absorbance spectra of FPS‐PVP NSs at different Fe concentrations (3, 6, 12, and 24 µg mL−1). b) Normalized extinction intensity divided by the length of the cell (A/L) at different concentrations for λ = 1064 nm. c) The heating curves of FPS‐PVP NSs under irradiation of 1064 nm laser at varied power intensities (1, 1.5, and 2 W cm−2). d) The heating curves of FPS‐PVP NSs at different Fe concentrations (15, 30, and 60 µg mL−1) under irradiation of 1064 nm laser (2 W cm−2). e) The heating and cooling curves of FPS‐PVP NSs for three laser on/off cycles. f) Plot of cooling time versus the negative natural logarithm of the temperature driving force obtained from the cooling stage shown in (e) for evaluating PTCE.