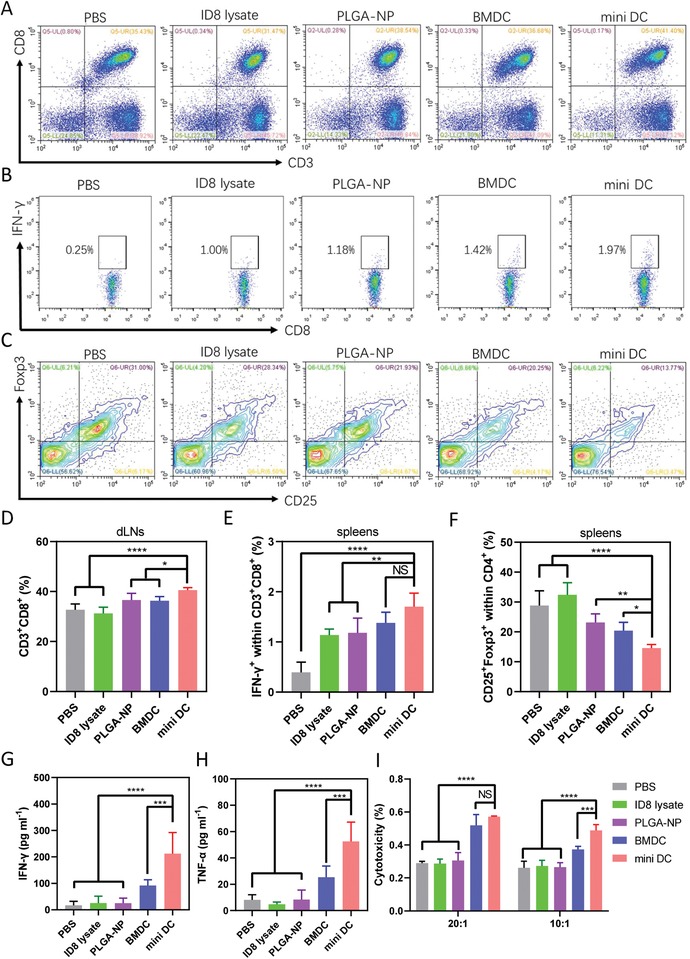
Figure 4.

In vivo activation of T cells by mini DC. A) Representative flow cytometry scatter plots and D) frequency of CD3+CD8+ T cells in dLNs of mice 3 days after immunization with six dosages of PBS, ID8 lysate, PLGA‐NP, BMDC, or mini DC (n = 5 biologically independent animals in each group). Flow cytometry analysis and percentage of B,E) IFN‐γ+CD8+ effector T cells and C,F) Foxp3+CD25+CD4+ regulatory T cells isolated from spleens of mice receiving different vaccinations. G) IFN‐γ and H) TNF‐α levels in serum of immunized mice measured by ELISA. I) Ex vivo cytotoxicity of CD8+ T cells isolated from spleens of immunized mice 3 days after vaccination with different vaccine formulations (n = 4). CD8+ T cells (effector cell) and ID8 cells (target cell) were cocultured at ratios of 20:1 and 10:1 (E:T) for 10 h. In panels (D)–(I), representative data were expressed as mean ± SD. One‐way ANOVA with Dunnett's posthoc analysis was used to calculate statistical significance. ****p < 0.0001, ***p < 0.001, **p < 0.01, and *p < 0.05. NS: no significance.
