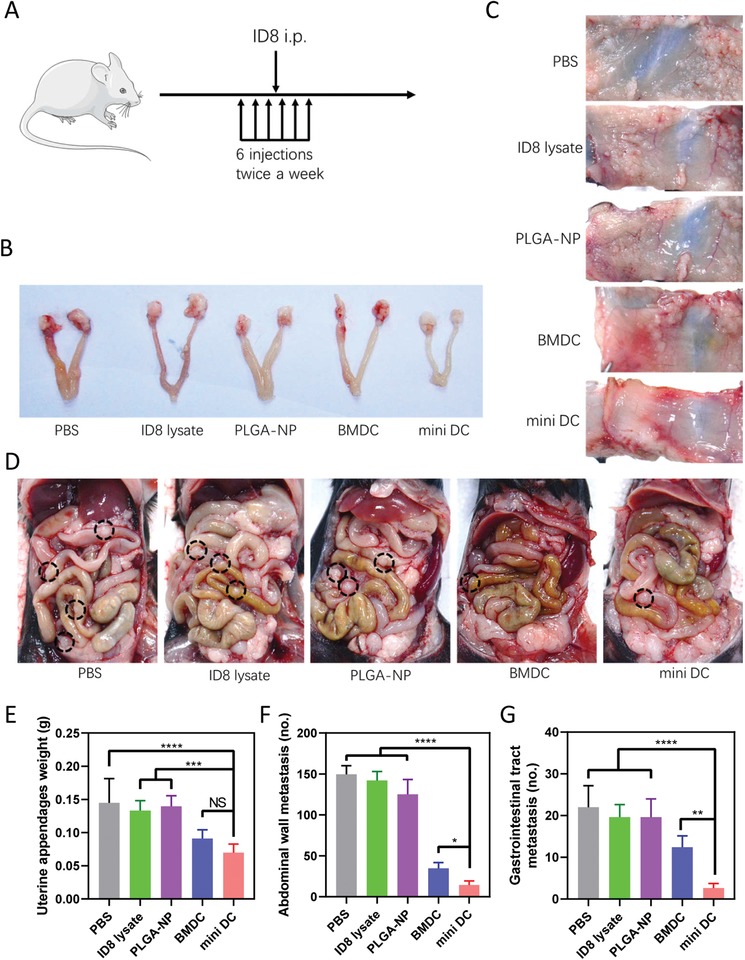
Figure 6.

Metastasis inhibition effect of mini DC. A) Schematic diagram for the regimen of antimetastasis immunization of mice on indicated days. After three vaccinations, mice were challenged with ID8 mouse ovarian cancer cells intraperitoneally, followed by another three doses (n = 5 biologically independent animals in each group). B) Representative digital images and E) weight of uterine appendages in mice vaccinated with different formulations. Representative digital images and statistical analysis for the number of the metastatic nodules on C,F) abdominal walls and D,G) gastrointestinal tracts from immunized mice 1 month after tumor cell inoculation. Black circles indicated the location of the metastatic nodules. In panels (E)–(G), data are represented as mean ± SD. One‐way ANOVA with Dunnett's posthoc analysis was used for the comparison between groups. ****p < 0.0001, ***p < 0.001, **p < 0.01, and *p < 0.05. NS: no significance.
