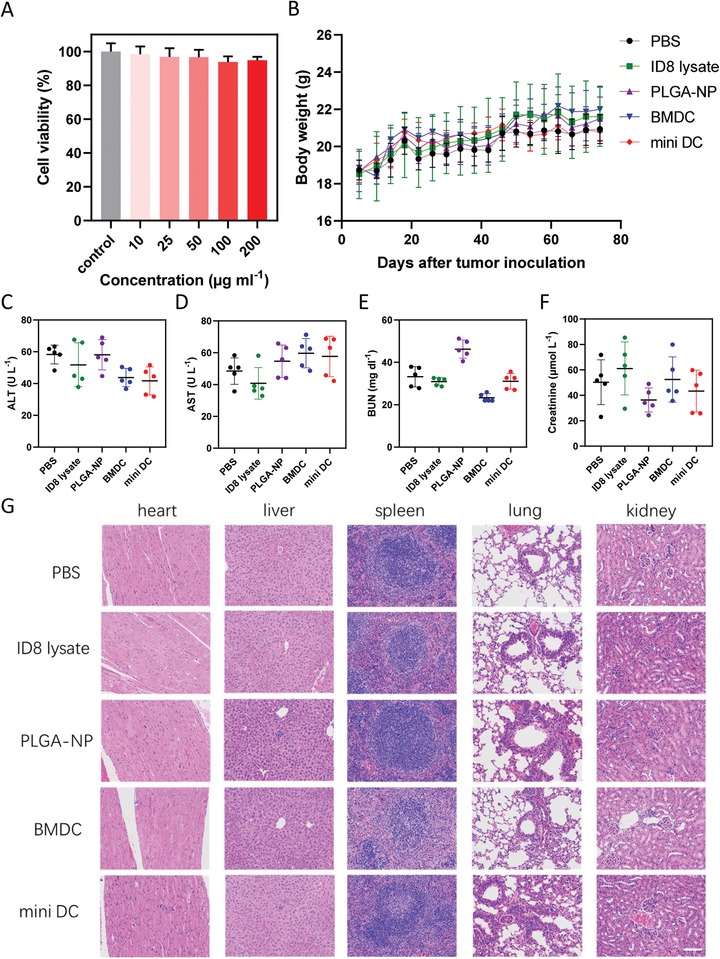
Figure 7.

Safety evaluation of mini DC. A) Cell viability of NIH‐3T3 cells incubated with various concentrations of mini DC for 24 h measured by CCK‐8 (n = 3). B) Body weight of the tumor‐bearing mice following tumor inoculation s.c. and corresponding treatments. C) ALT, D) AST, E) BUN, and F) creatinine levels in the serum of tumor‐bearing mice at the end of therapeutic study. G) Representative H&E staining images of heart, liver, spleen, lung, and kidney from mice treated with different vaccines. Scale bar: 100 µm. Results in panels (B)–(F) are expressed as mean ± SD, n = 5 biologically independent animals in panels (B)–(G).
