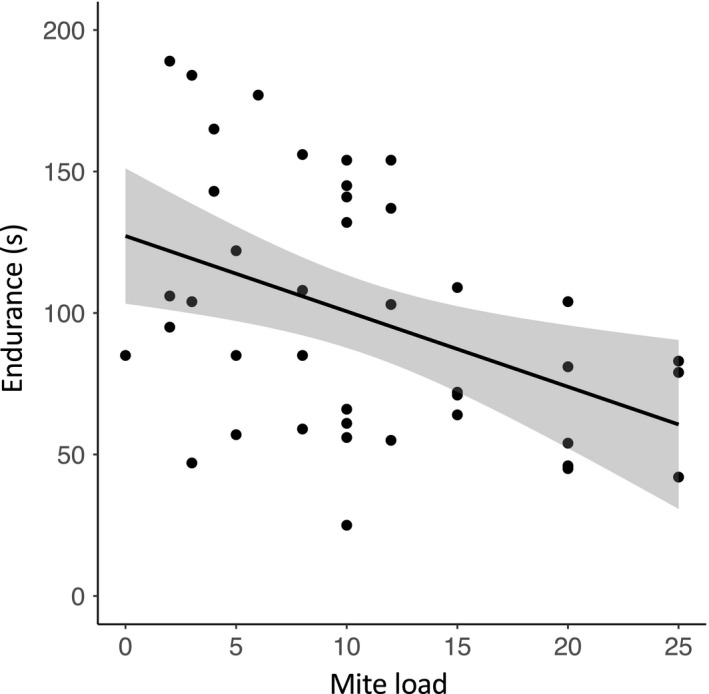
Figure 5.

Scatter plot showing the predicted negative relationship between mite load and scrub lizard endurance (p = .026, R 2 = .24). Scrub lizards with increased mite loads have less endurance than scrub lizards with fewer mites. The gray cloud surrounding the line of best fit is (±) 1 SE
