Figure 3.

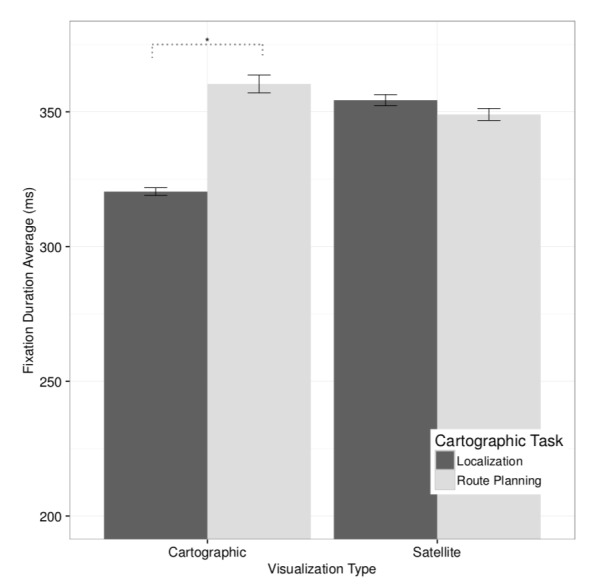
Interaction effect of task and visualization on average fixation duration. Whiskers represent ±1SE (standard error). Significant differences (p<0.05) are marked with ?.

Interaction effect of task and visualization on average fixation duration. Whiskers represent ±1SE (standard error). Significant differences (p<0.05) are marked with ?.