
Figure 2.
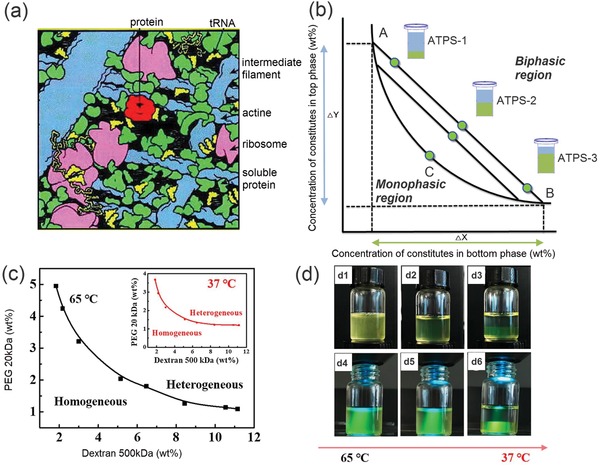
Intracellular macromolecular crowding and phase separation of ATPS. a) Schematics of the macromolecular crowding in eukaryotic cytoplasm. b) Schematics of the phase diagram of a typical aqueous two‐phase system. c) Phase diagrams of PEG/dextran ATPS at 65 and 37 °C (inset). d) Phase separation of the PEG/dextran ATPS when cooling down from 65 to 37 °C. The brightfield (top) and corresponding fluorescence photos of the ATPS are taken (bottom). a) Reproduced with permission.87 Copyright 2001, American Society for Biochemistry and Molecular BI. c,d) Reproduced with permission.113 Copyright 2018, Elsevier.