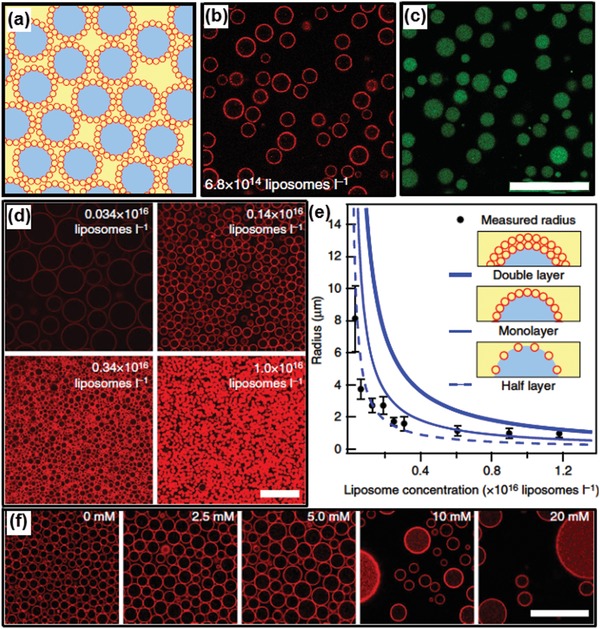
Figure 16.

Liposome‐stabilized all‐aqueous interfaces. a–c) Dextran droplets dispersed in PEG continuous phase. a) Schematic illustration (red, liposomes; blue, dextran phase; yellow, PEG phase). b) Fluorescence image showing location of DOPE‐Rhodamine‐labeled liposomes at the aqueous/aqueous interface. c) Fluorescence microscope image showing location of dextran phase labeled with FITC–dextran. d) Fluorescence microscope images show that the size of droplets is inversely correlated with the concentration of liposomes. e) Dependence of stabilized droplet sizes with liposome concentrations. f) Screening of charge leads to emulsion destabilization. At low ionic strength, a reduction in Debye length leads to tighter liposome packing at the interface, increasing the observed droplet size. As ionic strength increases, the liposomes can no longer prevent droplet coalescence. All scale bars are 25 µm. Reproduced with permission.172 Copyright 2014, Springer Nature.
