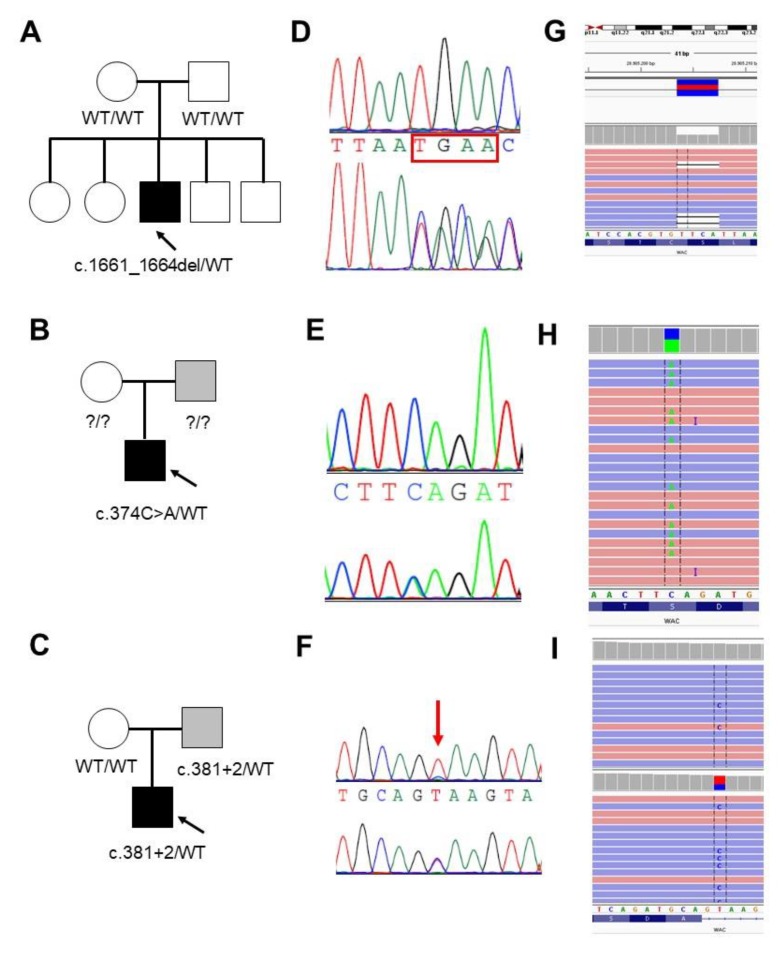
Figure 2.
Validation and segregation analysis of the three LoF WAC mutations. (A–C) Pedigrees of Family 1, 2 and 3, respectively. Probands are indicated with an arrow. (D–F) Electropherograms of the mutated positions (bottom) compared to the wild-type sequence (upper) (D,E) or to the mosaic father (upper) (F). (G–I) Screen shot from the Integrative Genomic Viewer (IGV) [18] visualization showing part of the reads at the mutated positions. (I) Reads show the presence of mosaicism (43/330; 12%) for the c.381 + 2T > C in the father evaluated in the DNA sample from oral mucosa (upper) compared to the proband (15/21; 42%) (bottom).

