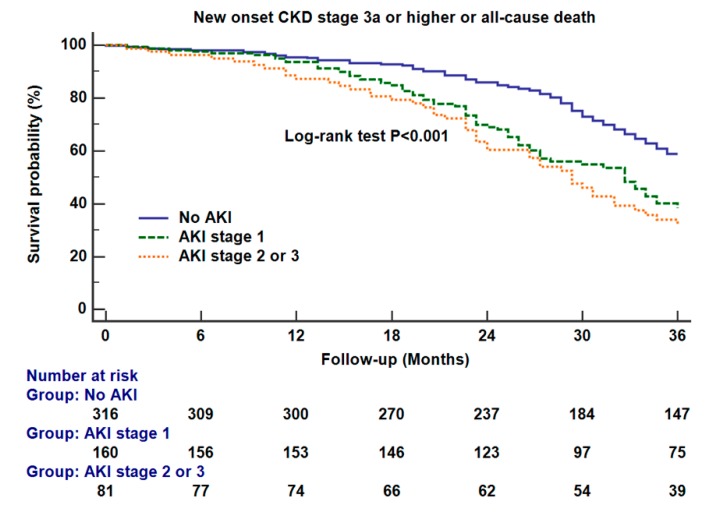
Figure 3.
Kaplan–Meier survival curve analysis for new-onset chronic kidney disease stage 3a or higher (estimated glomerular filtration rate < 60 mL/min/1.73 m2) or all-cause mortality as the primary outcome between different AKI groups. There were significant differences between the no AKI and AKI stage 1 groups (log-rank test p < 0.001) and between AKI stage 1 and stage 2 or 3 (log-rank test p = 0.023). The numbers of patients who had follow-up eGFR values at each time point were shown at the bottom of the figure.

