Figure 3.
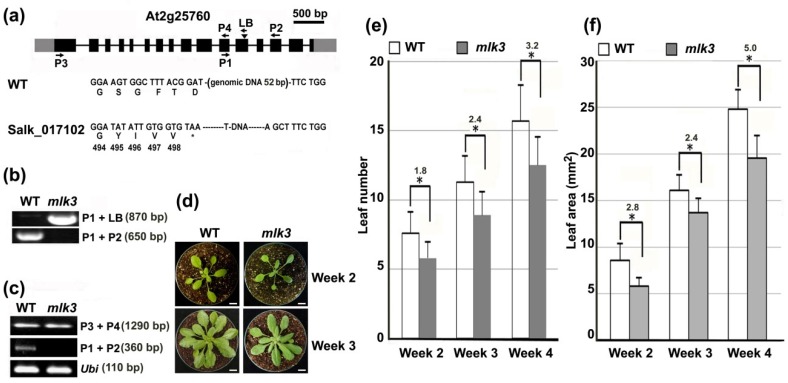
Leaf growth was retarded in mlk3. (a) Schematic representation of MLK3 (At2g25760) locus with a T-DNA insertion. Introns, exons and un-translated regions were represented as lines, black boxes and gray boxes, respectively. Triangle indicated the T-DNA insertion site of mlk3 (SALK_017102). Arrow indicated the location of primers (LB and P1-P4) used for genotyping or MLK3 transcript detection. Star represented the translation stop codon. (b) Genotyping of mlk3 by PCR with the indicated primer combinations. (c) Transcriptional analysis of MLK3 by RT-PCR using primers of P1 & P2 or P3 & P4 as indicated in (a). POLYUBIQUITIN 10 was used as an internal standard. (d) Image of the representative plants at week-2 (upper panel) and week-3 (lower panel). Bar = 1 cm. (e) Comparison of the leaf number between wild type and mlk3 at the indicated time points. * indicated the significant difference from wild type (Student’s t-test, p < 0.05). Leaf number difference between the two genotypes was indicated. Leaf with petiole was counted from 15 plants of each genotype and three replicates were conducted independently. (f) Comparison of leaf area between wild type and mlk3 at the indicated time points. The 5th leaf was measured and the leaf area was calculated using ImageJ (https://imagej.nih.gov/ij/download.html). Three batches of plants with 15 plants per batch were analyzed independently. * indicated the significant difference from wild type (Student’s t-test, p < 0.05). The difference of leaf area between the two genotypes was indicated (mm2).

