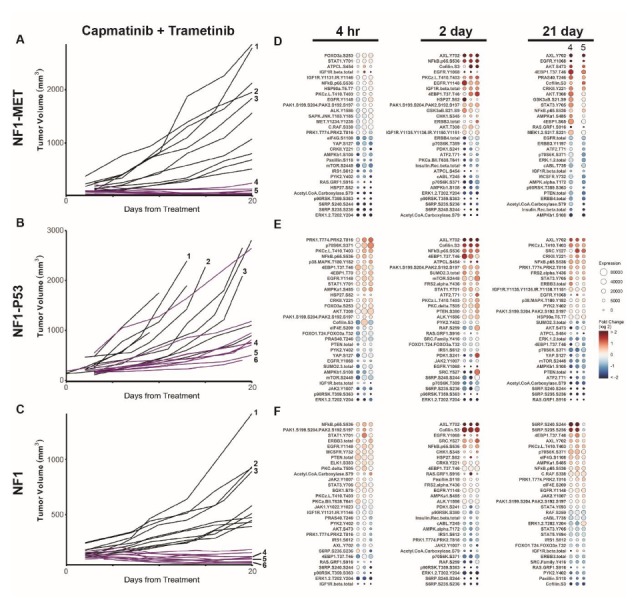
Figure 3.

Combination MEK and MET inhibition reveals differential innate and adaptive kinome reprogramming. Individual tumor growth curves for (A) NF1-MET, (B) NF1-P53, and (C) NF1 tumorgrafts plotted by treatment (colored lines) compared to the vehicle (black lines). The analysis of tumor growth data was previously reported [6]. The annotated tumors were analyzed by RPPA (D–F). The fold change relative to the mean protein expression of control tumors (i.e., #1–3) was calculated for each tumor #4–6, with the first column of Panel A at 21 days corresponding to tumor #4, the second to tumor #5, and the third to tumor #6. Ranked balloon plots of the proteins with the highest and lowest fold change in expression after 4-h, 2-day, and 21-day treatment of the NF1-MET model with combination therapy. Each column represents a single animal. Balloon color indicates the fold change in expression relative to the vehicle mean (n = 3) for that time point. Balloon size indicates the absolute protein expression normalized to the total protein input and background.
