
Figure 2.
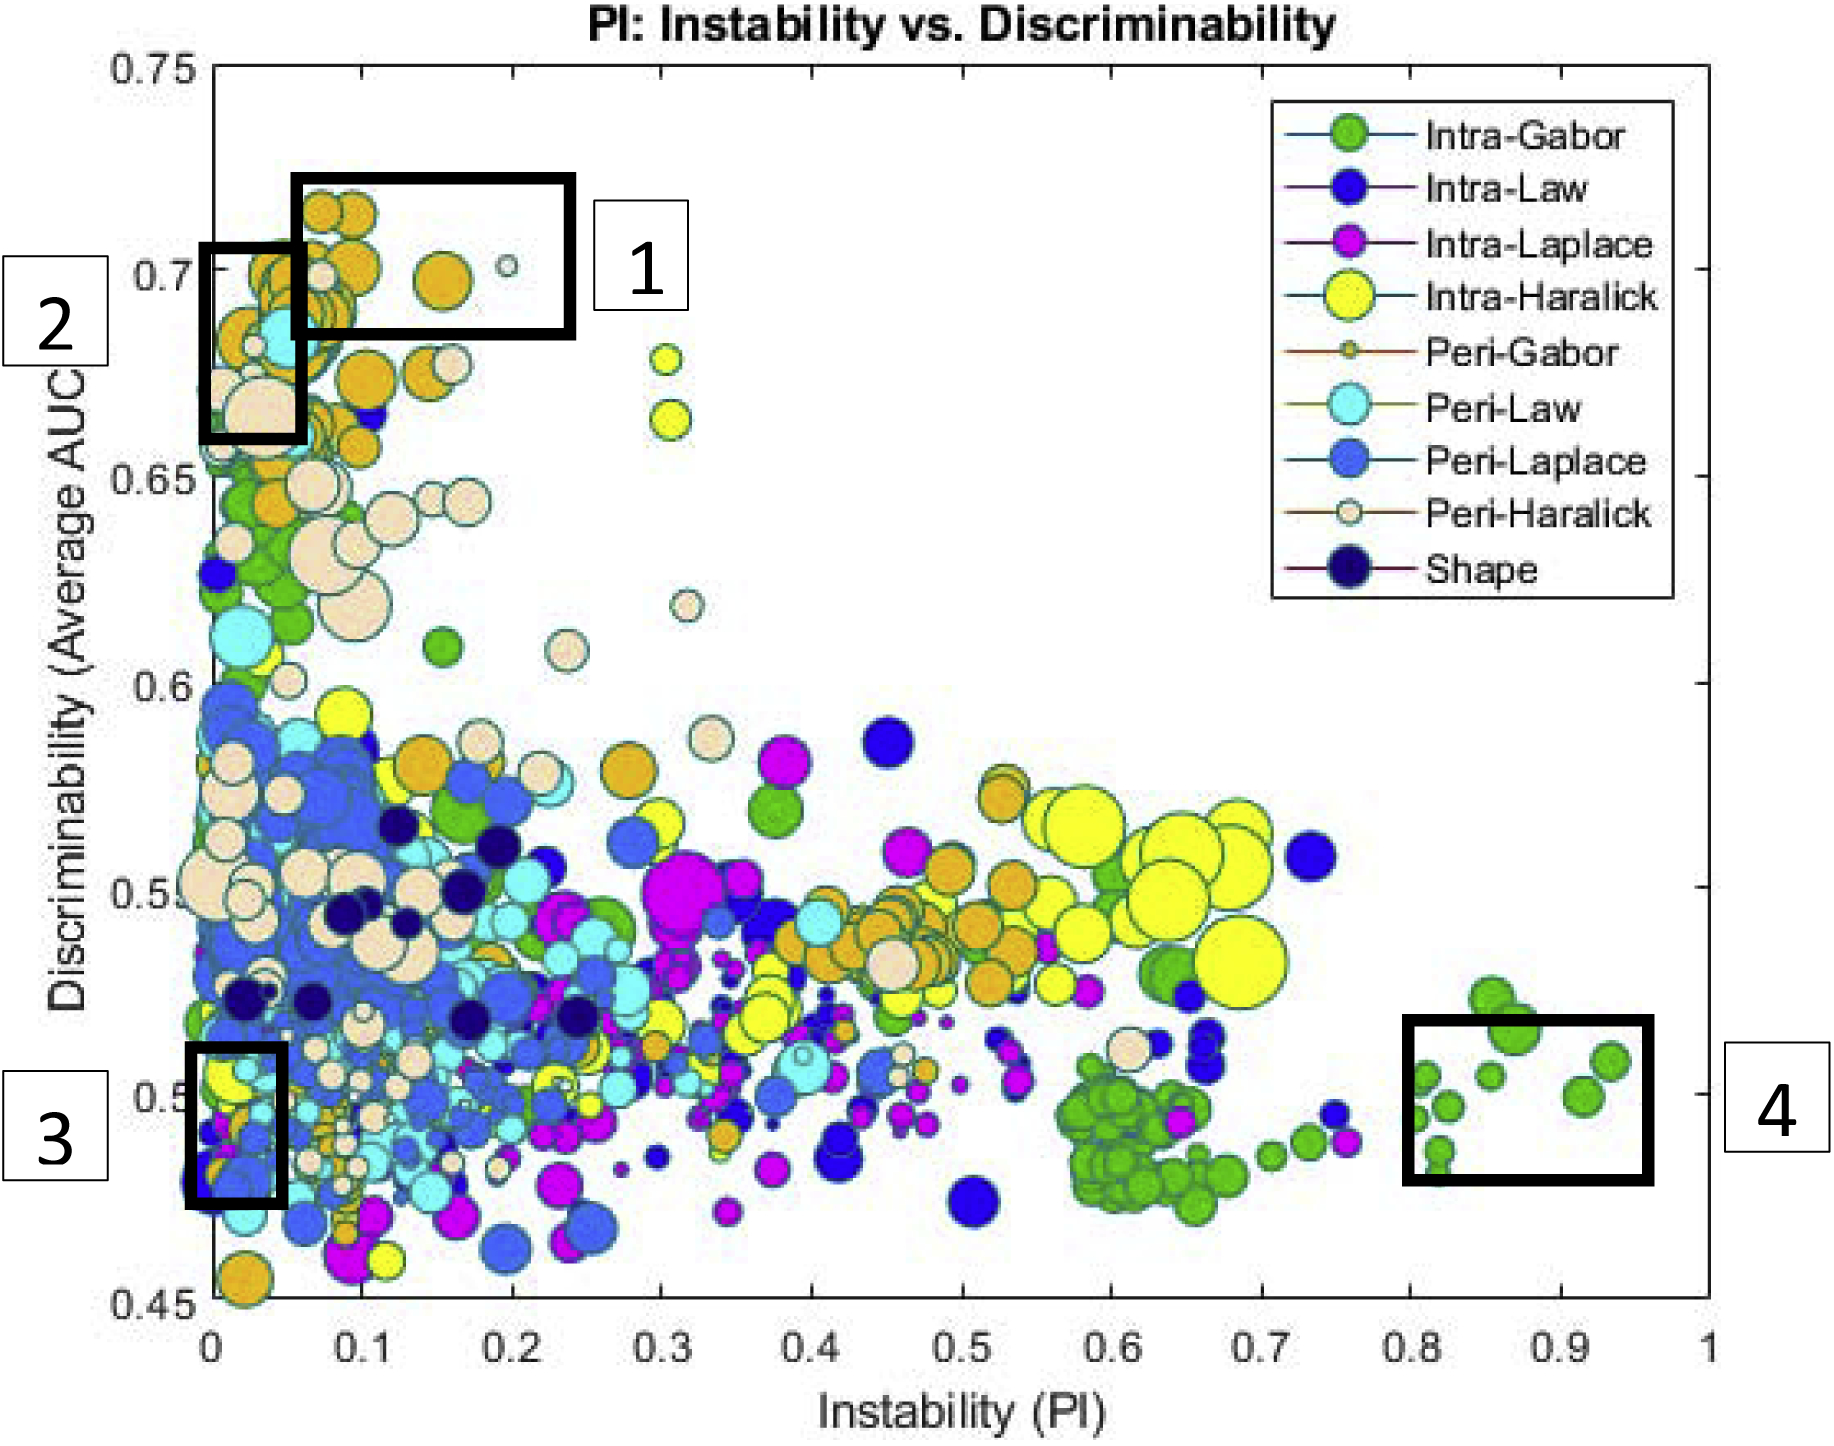
PI-AUC plot for 1356 features for 175 patients (training set) across two sites for prognosis classification task. Each feature is represented by a dot, color coded according to feature family. The size of each ball is the standard deviation of 12 different classifiers used for calculating average AUC. On the X-axis is the PI value for each feature associated with the cancer recurrence across the two sites. On the Y-axis is the corresponding AUC value for each feature. The AUC values were averaged across 100 iterations of 3-fold cross validation across all 175 patients from the two sites.