
Figure 3.
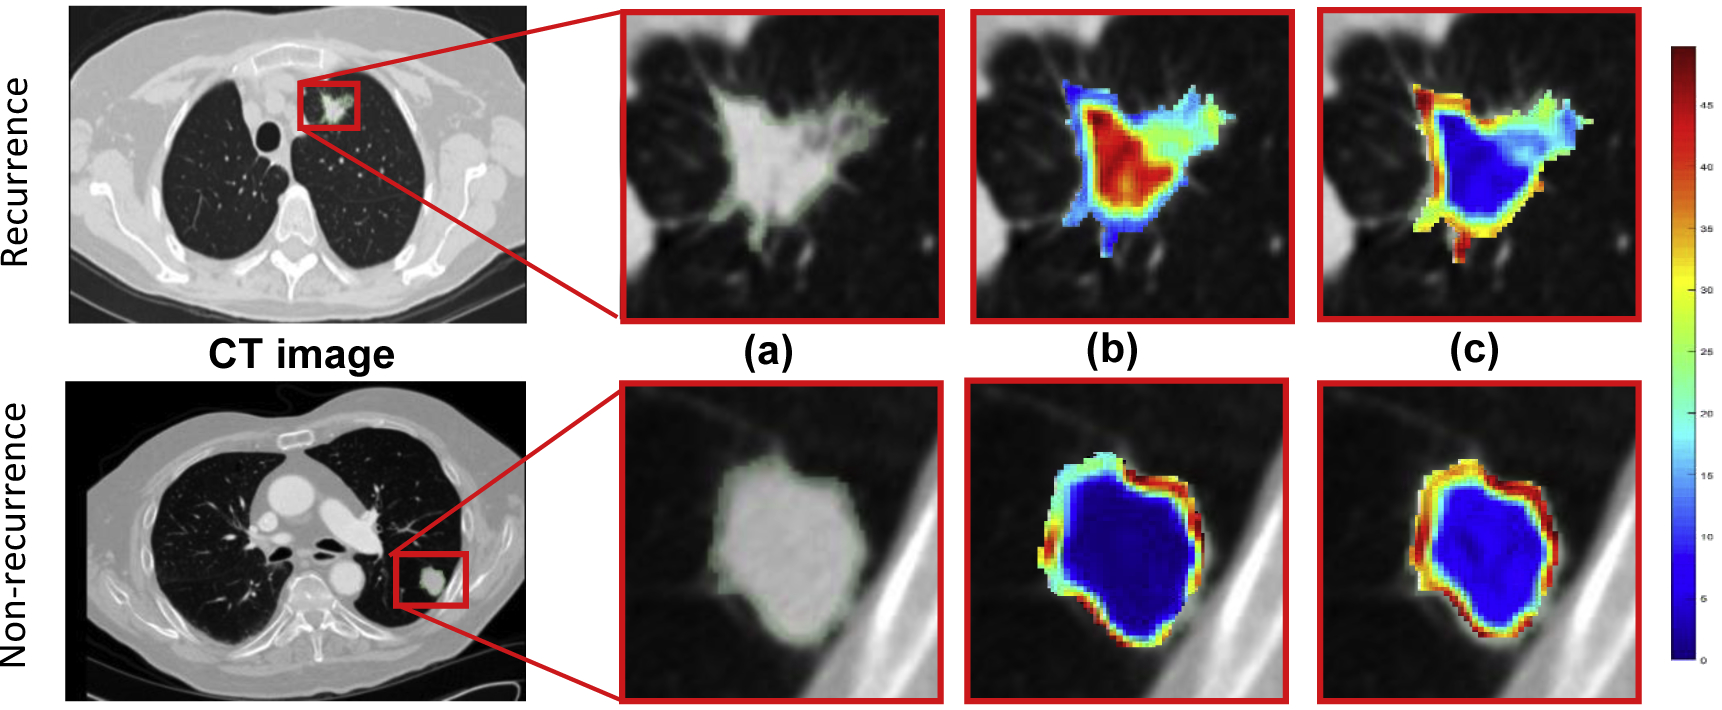
An illustration of lung nodule CT scans and associated feature maps. (a) ROI corresponding to the nodule within the CT scan of a recurrence (top) and a non-recurrence (bottom). Feature heat maps corresponding to two different intratumoral Haralick entropy feature with (b) PI = 0.1, AUC = 0.67 and (c) PI = 1, AUC = 0.68. Both have equivalent discrimination, but one is significantly more stable than the other.