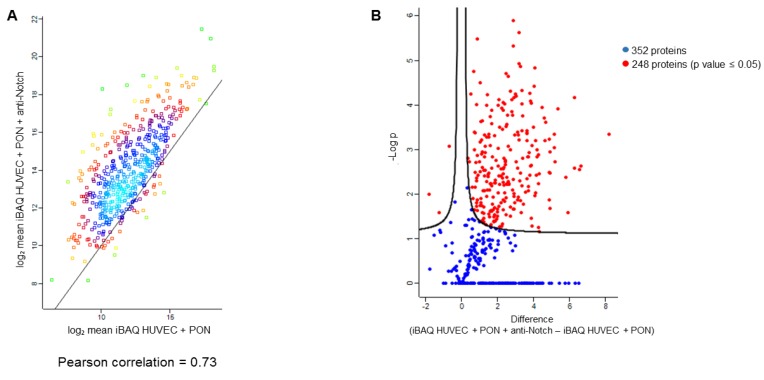
Figure A1.
Volcano plot showing the proteins that are differentially expressed in the HUVECs treated with 1.7 nM ponatinib in the presence or absence of 1 μg/mL neutralizing factor anti-Notch-1 antibody. (A) Density plot showing mean Pearson correlation of average iBAQ between the two cellular treatments. (B) Dot plot representing the proteins differentially expressed in the two cellular treatments.

