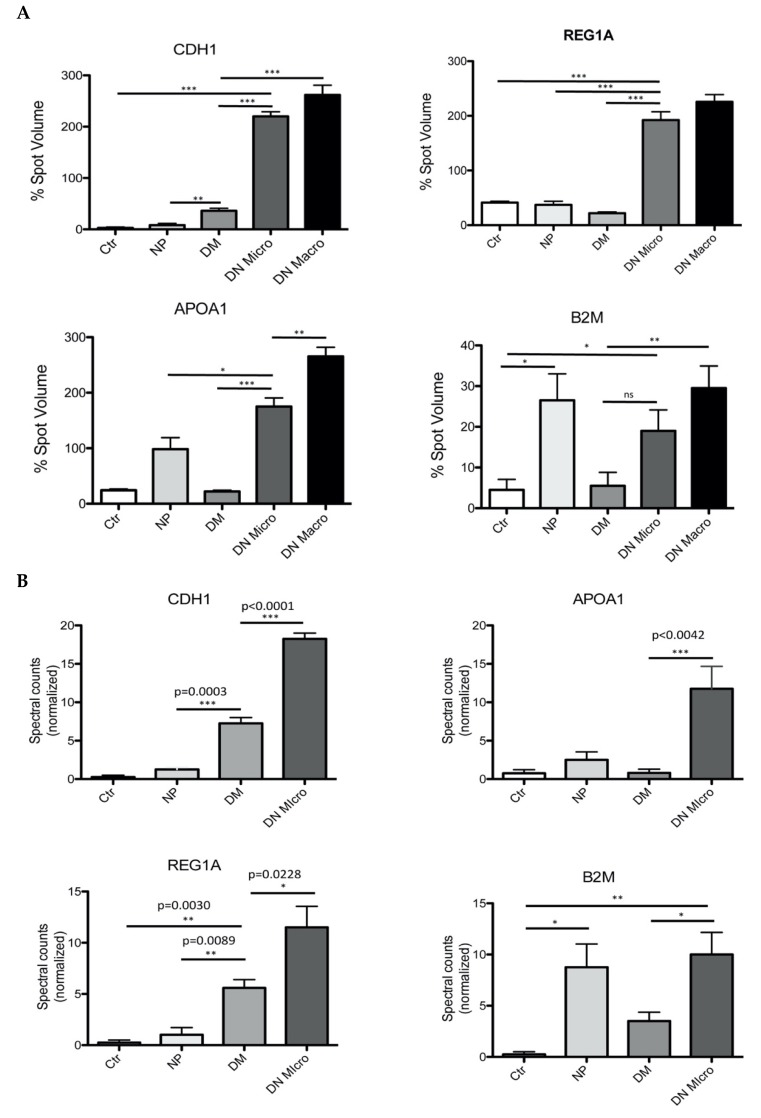
Figure 1.
Two-Dimensional Difference In-Gel Electrophoresis (2D-DIGE) separation and quantification of the urine protein excretion level. (A) spot volume quantification of four proteins found (CDH1, REG1A, APOA1, B2M) to differentiate between the investigated groups. The protein excretion quantification for the four proteins is given in form of bar diagrams. Results are given as the means ± SD of the percentage volume of spot as quantified by 2D-DIGE. All the proteins showed significant changes in their excretion level between the four investigated groups (p < 0.05) (B) Mass spectrometric analysis and spectral account-based quantification of the protein of interest in urine of the four investigated groups. The software we used to quantify the protein abundance based on mass spectrometry is “Scaffold” (version Scaffold_4.4.5, Proteome Software Inc., Portland, OR, USA). MS/MS data are normalized between the samples; this allows a comparative analysis of the abundances of a protein between analyzed groups. All the proteins investigated, showed a significant level changes between the groups (p < 0.05). Ctr: healthy controls, NP: proteinuria without diabetes, DM: diabetic without nephropathy, DN Micro: diabetes with microalbuminuria, DN Macro: diabetes with macroalbuminuria.

