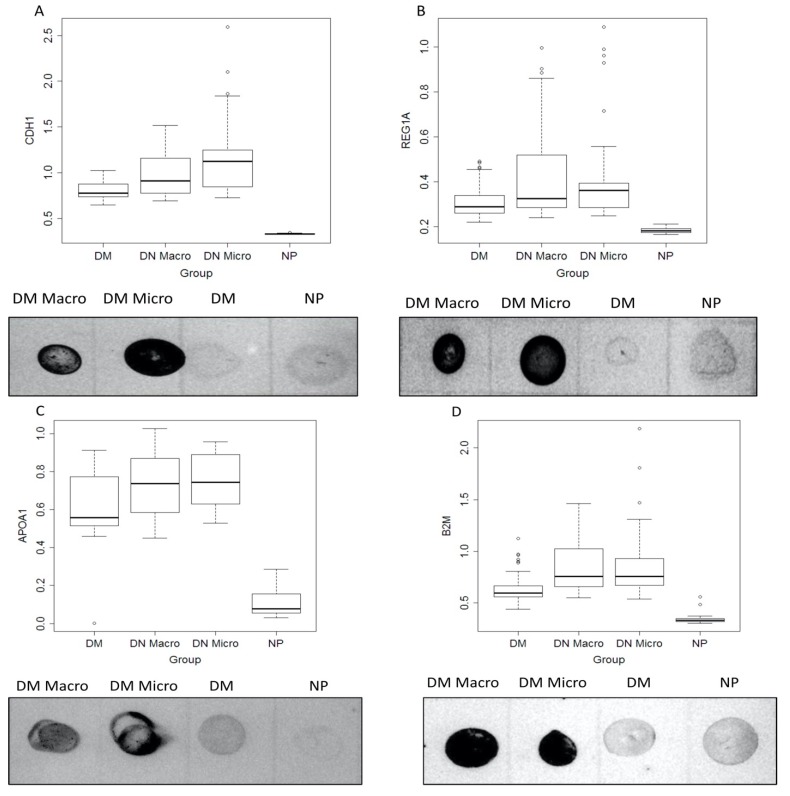
Figure 4.
Dot blot analysis of the identified biomarker in larger patient’s cohort. (A,B) CDH1 and REG1A, (C,D) APOA1 and B2M. Urine samples from 60 patients each group (DM, DN Macro, DN Micro) and 32 for NP group were collected and proteins were prepared as described in material and methods. For dot blot analysis 10 µg from each sample were loaded in triplicate. On the y-axis the line-volume-percentage is given, and the x-axis shows investigated patients groups.

