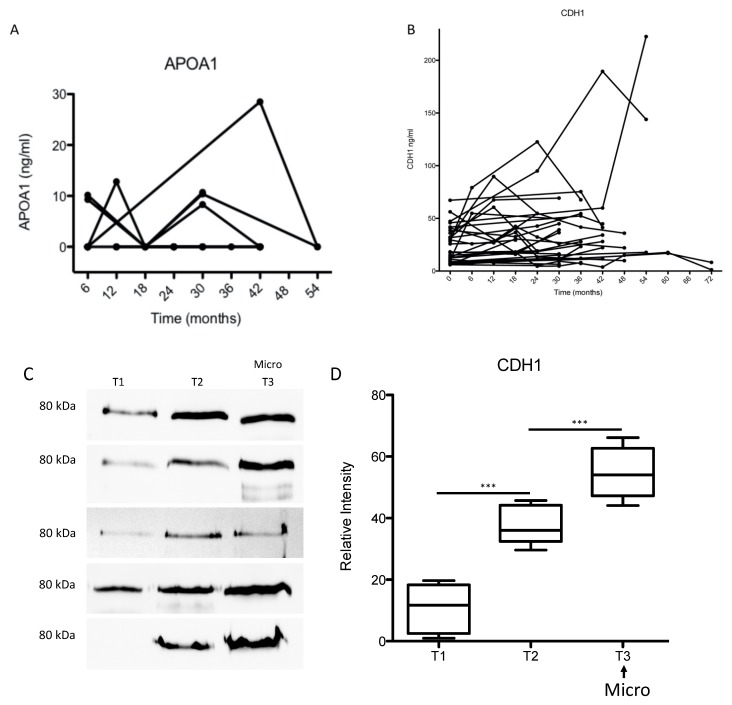
Figure 6.
(A,B) ELISA analyses and quantification of CDH1 and APOA1 in flow-up samples. Urine samples from DM patients were collected over 72 months. The samples were retrospectively analyzed with ELISA to quantify CDH1 and APOA1 excretion level in urine. On the y-axis the measured protein concentration in ng/mL protein and the x-axis shows the urine collection time in months. Statistical analyses were performed by Prizma4 software. The quantification of the marker in the follow-up samples showed in large number of samples for CDH1 (B) a correlation between the excretion level and the progression towards microalbuminuria. Whereas for APOA1, the majority of the samples were negative for the proteins and the samples where APOA1 (A) was detected did not show any correlation between the amount of APOA1 and the progression towards nephropathy. (C,D) Western blot analyses and quantification of CDH1 in the follow-up cohort samples. Three follow-up urine samples were used for each patient. The three samples included the sample where the microalbuminuria was detected for the first time (T3) and two pre-microalbuminuric urine samples (T1 and T2). The collection times in this group was about 30 months, *** p < 0.001. T2 = T1 + 12–18 months; T3 = T2 + 6–12 months.

