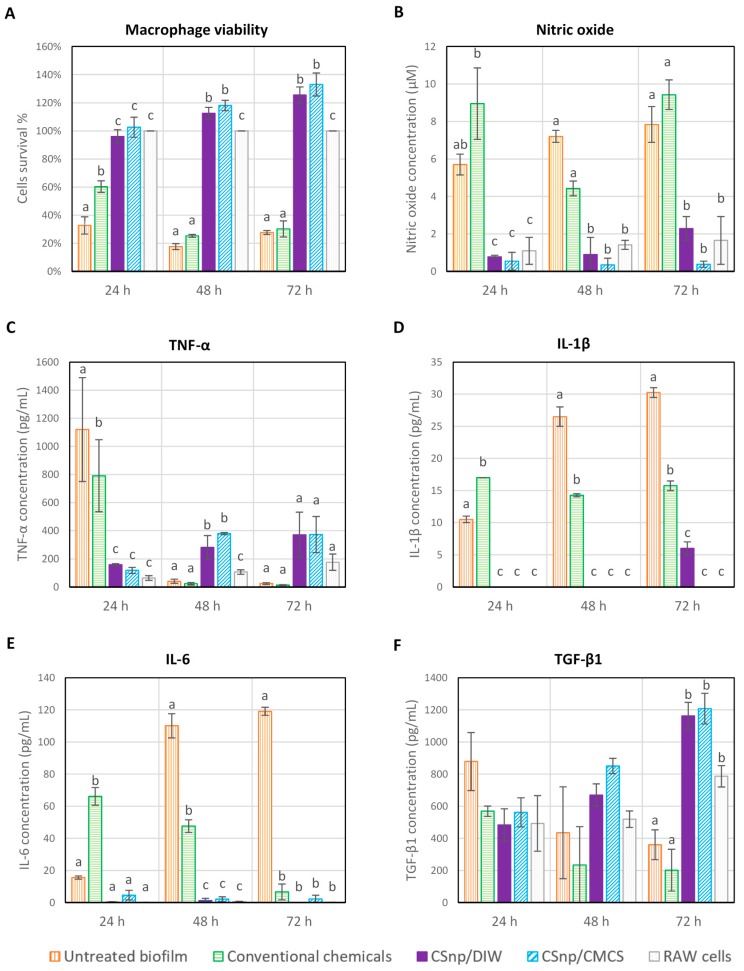
Figure 5.
Macrophage survival and inflammatory markers production following interaction of treated 6-week-old E. faecalis biofilm and RAW264.7 macrophages (A) Relative cell viability, (B) Nitric oxide release, (C) TNF-α level (D) IL-1β level, (E) IL-6 level and (F) TGF-β1 level. Error bars represent standard error of the mean, different characters above bars indicate statistically significant difference between the groups at each time point (p < 0.01).

